Copyright
©The Author(s) 2017.
World J Gastroenterol. Mar 21, 2017; 23(11): 2044-2051
Published online Mar 21, 2017. doi: 10.3748/wjg.v23.i11.2044
Published online Mar 21, 2017. doi: 10.3748/wjg.v23.i11.2044
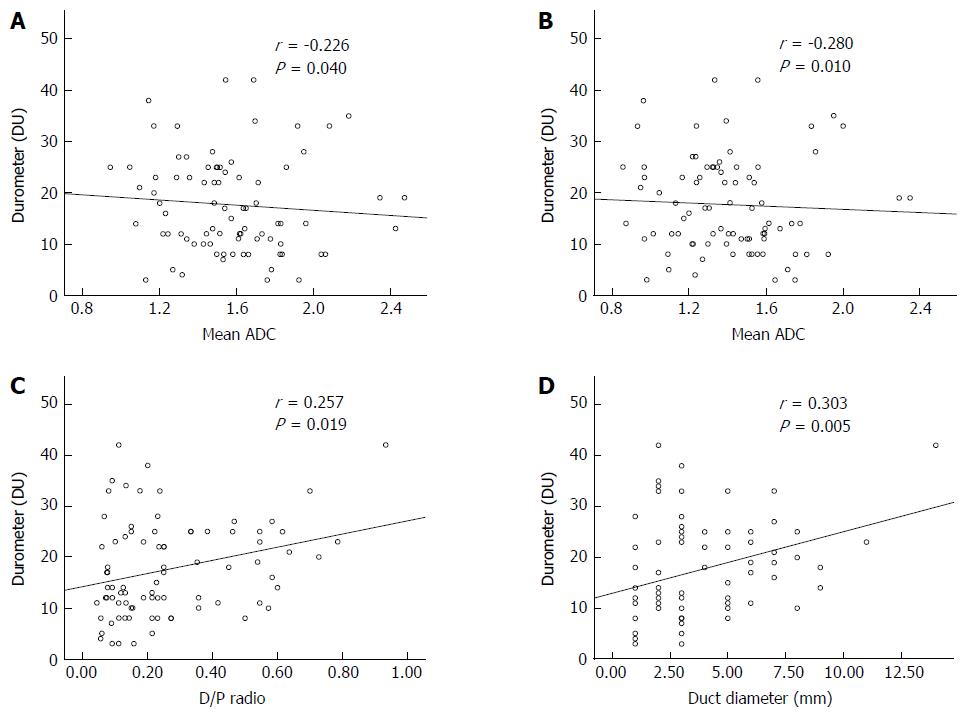
Figure 4 Scatter plots of durometer measurements vs apparent diffusion coefficient values.
The durometer results are statistically significantly correlated with the mean apparent diffusion coefficient (ADC) (A), minimal ADC (B), duct-to-pancreas diameter ratio (C) and duct diameter (D).
- Citation: Hong TH, Choi JI, Park MY, Rha SE, Lee YJ, You YK, Choi MH. Pancreatic hardness: Correlation of surgeon’s palpation, durometer measurement and preoperative magnetic resonance imaging features. World J Gastroenterol 2017; 23(11): 2044-2051
- URL: https://www.wjgnet.com/1007-9327/full/v23/i11/2044.htm
- DOI: https://dx.doi.org/10.3748/wjg.v23.i11.2044


