Copyright
©The Author(s) 2017.
World J Gastroenterol. Mar 21, 2017; 23(11): 2002-2011
Published online Mar 21, 2017. doi: 10.3748/wjg.v23.i11.2002
Published online Mar 21, 2017. doi: 10.3748/wjg.v23.i11.2002
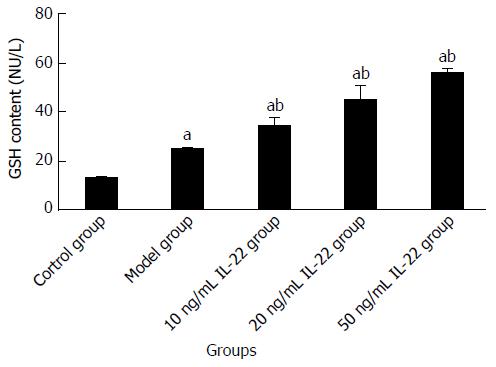
Figure 11 Content of glutathione in different groups.
aP < 0.05 vs the control group; bP < 0.05 vs the model group. GSH: Glutathione; IL: Interleukin.
- Citation: Ni YH, Huo LJ, Li TT. Antioxidant axis Nrf2-keap1-ARE in inhibition of alcoholic liver fibrosis by IL-22. World J Gastroenterol 2017; 23(11): 2002-2011
- URL: https://www.wjgnet.com/1007-9327/full/v23/i11/2002.htm
- DOI: https://dx.doi.org/10.3748/wjg.v23.i11.2002


