Copyright
©The Author(s) 2016.
World J Gastroenterol. Feb 28, 2016; 22(8): 2566-2575
Published online Feb 28, 2016. doi: 10.3748/wjg.v22.i8.2566
Published online Feb 28, 2016. doi: 10.3748/wjg.v22.i8.2566
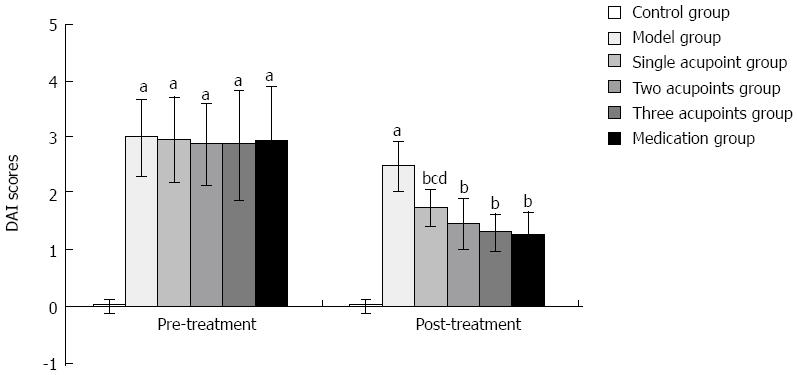
Figure 1 Comparison of DAI scores.
DAI decreased significantly after the different treatments. Data are expressed as mean ± SD; n = 8/group. aP < 0.01 vs control group; bP < 0.01 vs model group; cP < 0.05 vs three acupoints group; dP < 0.05 vs medication group. DAI: Disease activity index.
- Citation: Ma TM, Xu N, Ma XD, Bai ZH, Tao X, Yan HC. Moxibustion regulates inflammatory mediators and colonic mucosal barrier in ulcerative colitis rats. World J Gastroenterol 2016; 22(8): 2566-2575
- URL: https://www.wjgnet.com/1007-9327/full/v22/i8/2566.htm
- DOI: https://dx.doi.org/10.3748/wjg.v22.i8.2566


