Copyright
©The Author(s) 2016.
World J Gastroenterol. Dec 28, 2016; 22(48): 10545-10556
Published online Dec 28, 2016. doi: 10.3748/wjg.v22.i48.10545
Published online Dec 28, 2016. doi: 10.3748/wjg.v22.i48.10545
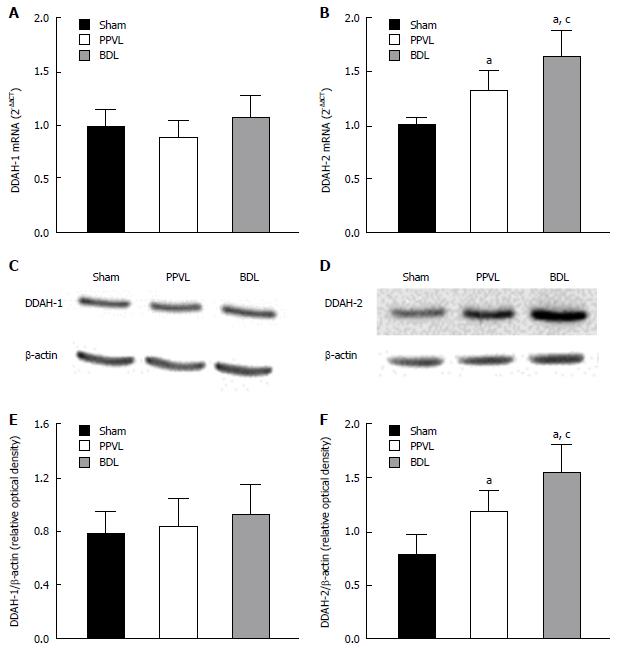
Figure 4 DDAH1 and DDAH2 expression in kidneys from portal hypertensive and cirrhotic rats.
A and B: DDAH1 and DDAH2 mRNA expression in kidney from Sham, PPVL, and BDL groups normalized to the expression of GAPDH, which was used as an endogenous reference gene; C and D: Immunoblot analysis in single kidney probed with antibodies against DDAH1, DDAH2 or β-actin, as indicated; E and F: Graphs show the results of densitometric analyses from pooled data, plotted as optical densitometry relative to the signal obtained by β-actin. Each data set represents the mean ± SEM derived from 6 independent experiments. aP < 0.05 vs Sham group and cP < 0.05 vs PPVL group. DDAH: Dimethylarginine dimethylaminohydrolase.
- Citation: Segarra G, Cortina B, Mauricio MD, Novella S, Lluch P, Navarrete-Navarro J, Noguera I, Medina P. Effects of asymmetric dimethylarginine on renal arteries in portal hypertension and cirrhosis. World J Gastroenterol 2016; 22(48): 10545-10556
- URL: https://www.wjgnet.com/1007-9327/full/v22/i48/10545.htm
- DOI: https://dx.doi.org/10.3748/wjg.v22.i48.10545


