Copyright
©The Author(s) 2016.
World J Gastroenterol. Dec 14, 2016; 22(46): 10232-10241
Published online Dec 14, 2016. doi: 10.3748/wjg.v22.i46.10232
Published online Dec 14, 2016. doi: 10.3748/wjg.v22.i46.10232
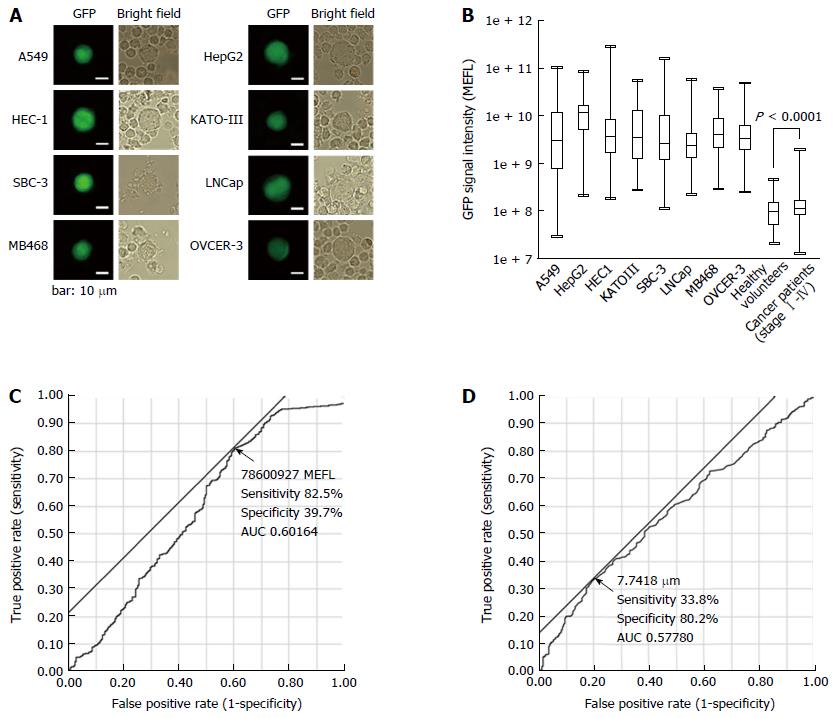
Figure 1 Comparison of green fluorescent protein fluorescence intensity and cell diameter.
A: Gallery of GFP-positive cell lines. The cell lines used were A549, HepG2, HEC-1, KATO-III, SBC-3, LNCaP, MDA-MB-468, and OVCAR-3; B: Comparison of GFP fluorescence intensity of cultured cell lines and blood cells from healthy volunteers and gastric cancer patients. The bottom and top of the box represent the lower and upper quartiles, and the band across the box shows the median. The lower and upper bars at the ends of the whiskers show the lowest data point and the highest data point, respectively. The cell lines used were A549, HepG2, HEC-1, KATO-III, SBC-3, LNCaP, MDA-MB-468 and OVCAR-3; C: Comparison of GFP fluorescence intensity between patients and healthy volunteers; D: Comparison of cell diameter between patients and healthy volunteers. To determine the cut-off line, we used ROC analysis to compare the GFP fluorescence intensity and diameter of cells from gastric cancer patients with those of healthy volunteers. Cells from the patients with gastric cancer had higher GFP intensities than those from the healthy volunteers (cut-off 78600927 MEFL sensitivity 82.5 %, specificity 39.7 %, and AUC 0.602). The diameters of GFP-positive cells in samples from patients with gastric cancer were higher than those in samples from healthy volunteers (cut-off 7.7418 μm, sensitivity 33.8 %, specificity 80.2 %, and AUC 0.578). GFP: Green fluorescent protein.
- Citation: Ito H, Sato J, Tsujino Y, Yamaguchi N, Kimura S, Gohda K, Murakami K, Onimaru M, Ohmori T, Ishikawa F, Inoue H. Long-term prognostic impact of circulating tumour cells in gastric cancer patients. World J Gastroenterol 2016; 22(46): 10232-10241
- URL: https://www.wjgnet.com/1007-9327/full/v22/i46/10232.htm
- DOI: https://dx.doi.org/10.3748/wjg.v22.i46.10232


