Copyright
©The Author(s) 2016.
World J Gastroenterol. Oct 21, 2016; 22(39): 8812-8819
Published online Oct 21, 2016. doi: 10.3748/wjg.v22.i39.8812
Published online Oct 21, 2016. doi: 10.3748/wjg.v22.i39.8812
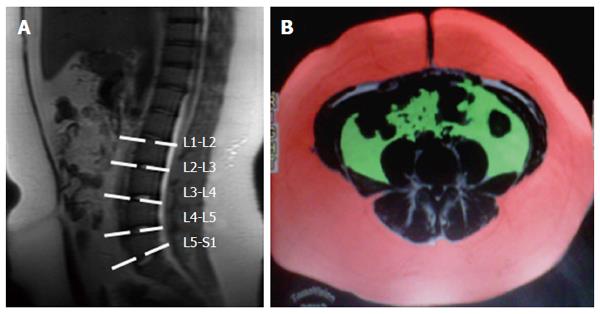
Figure 1 Subcutaneous and visceral fat measurement technique.
A: Sagittal T1-weighted localizer MR image used to select levels for analysis (L1-L2, L2-L3, L3-L4, L4-L5, L5-S1); B: Axial T1-weighted MR image with water suppression at the L4-L5 level. Contrast was manually adjusted to select signal from subcutaneous (red) and visceral (green) adipose tissue. Area of this fat was calculated by the workstation and summarized with that of other levels.
- Citation: Di Martino M, Pacifico L, Bezzi M, Di Miscio R, Sacconi B, Chiesa C, Catalano C. Comparison of magnetic resonance spectroscopy, proton density fat fraction and histological analysis in the quantification of liver steatosis in children and adolescents. World J Gastroenterol 2016; 22(39): 8812-8819
- URL: https://www.wjgnet.com/1007-9327/full/v22/i39/8812.htm
- DOI: https://dx.doi.org/10.3748/wjg.v22.i39.8812


