Copyright
©The Author(s) 2016.
World J Gastroenterol. Oct 7, 2016; 22(37): 8334-8348
Published online Oct 7, 2016. doi: 10.3748/wjg.v22.i37.8334
Published online Oct 7, 2016. doi: 10.3748/wjg.v22.i37.8334
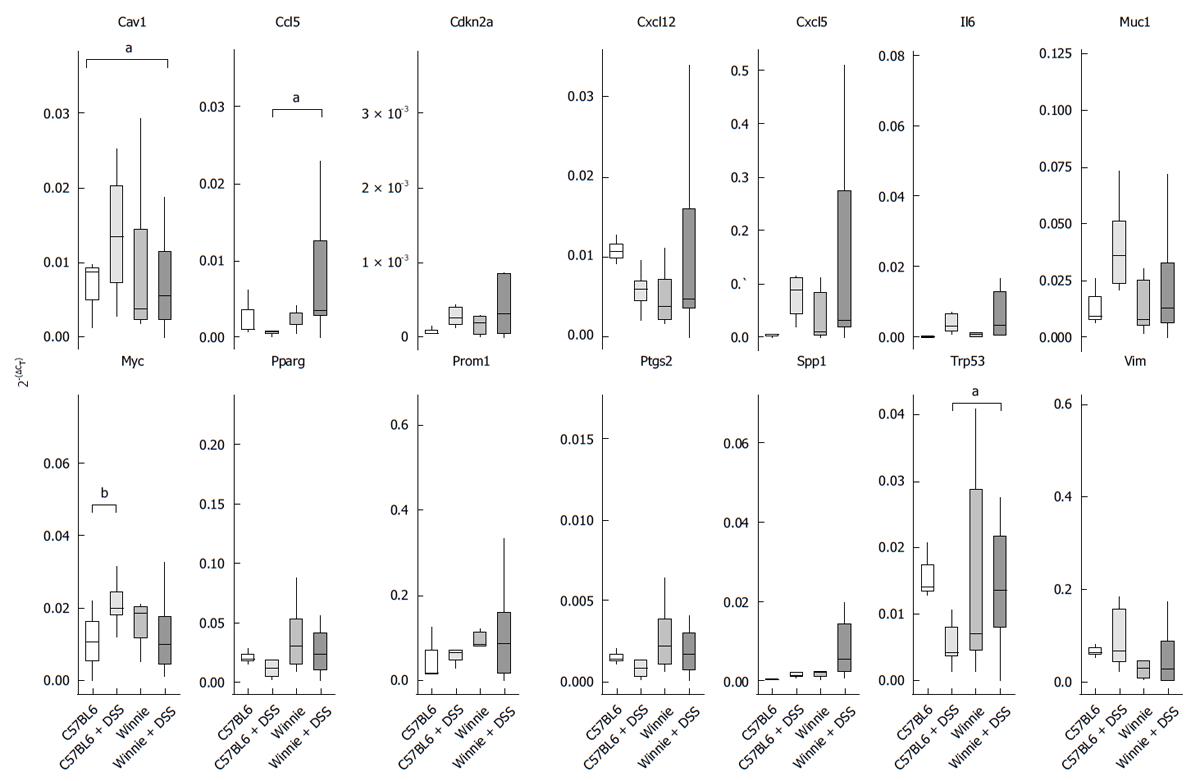
Figure 7 Relative transcript abundance of genes regulating inflammation and cell proliferation.
Transcript abundance measured from 25 ng of template based on the linearised 2-ΔCT method, where each gene of interest was normalised to the relative abundance of a reference gene (Gapdh). Box plot depicts interquartile range (IQR) either side of the median for each combination of treatment and genotype (3-11 mice per group). Whiskers represent 1.5 IQR approximately equivalent to 5%-95% confidence intervals. aP < 0.05, bP < 0.01.
- Citation: Randall-Demllo S, Fernando R, Brain T, Sohal SS, Cook AL, Guven N, Kunde D, Spring K, Eri R. Characterisation of colonic dysplasia-like epithelial atypia in murine colitis. World J Gastroenterol 2016; 22(37): 8334-8348
- URL: https://www.wjgnet.com/1007-9327/full/v22/i37/8334.htm
- DOI: https://dx.doi.org/10.3748/wjg.v22.i37.8334


