Copyright
©The Author(s) 2016.
World J Gastroenterol. Aug 28, 2016; 22(32): 7332-7341
Published online Aug 28, 2016. doi: 10.3748/wjg.v22.i32.7332
Published online Aug 28, 2016. doi: 10.3748/wjg.v22.i32.7332
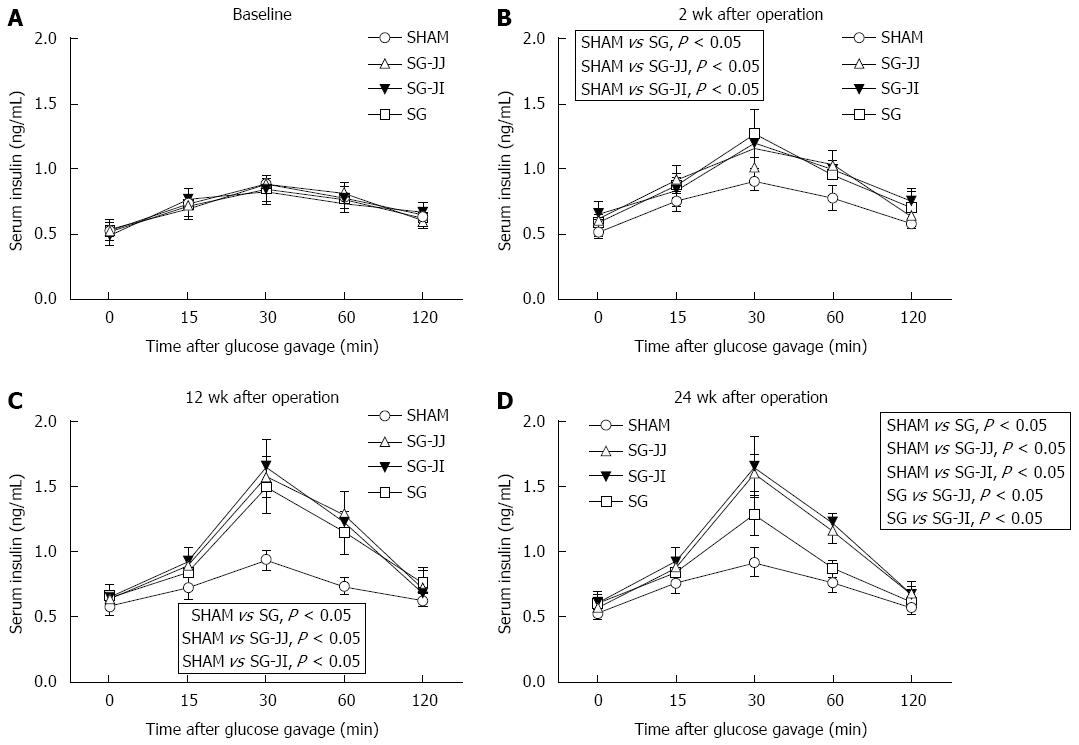
Figure 4 Insulin secretion curves after gavage at baseline (A), and 2 wk (B), 12 wk (C) and 24 wk (D) after surgery.
Analysis was carried out by mixed model ANOVA followed by Bonferroni post hoc comparison. The P value is shown in the rectangular frame. P < 0.05 was considered statistically significant. SHAM: Sham-operated; SG: Sleeve gastrectomy; SG-JJ: SG with jejuno-jejunal loop; SG-JI: SG with jejuno-ileal loop.
- Citation: Zhong MW, Liu SZ, Zhang GY, Zhang X, Hu SY. Effects of sleeve gastrectomy with jejuno-jejunal or jejuno-ileal loop on glycolipid metabolism in diabetic rats. World J Gastroenterol 2016; 22(32): 7332-7341
- URL: https://www.wjgnet.com/1007-9327/full/v22/i32/7332.htm
- DOI: https://dx.doi.org/10.3748/wjg.v22.i32.7332


