Copyright
©The Author(s) 2016.
World J Gastroenterol. Aug 28, 2016; 22(32): 7332-7341
Published online Aug 28, 2016. doi: 10.3748/wjg.v22.i32.7332
Published online Aug 28, 2016. doi: 10.3748/wjg.v22.i32.7332
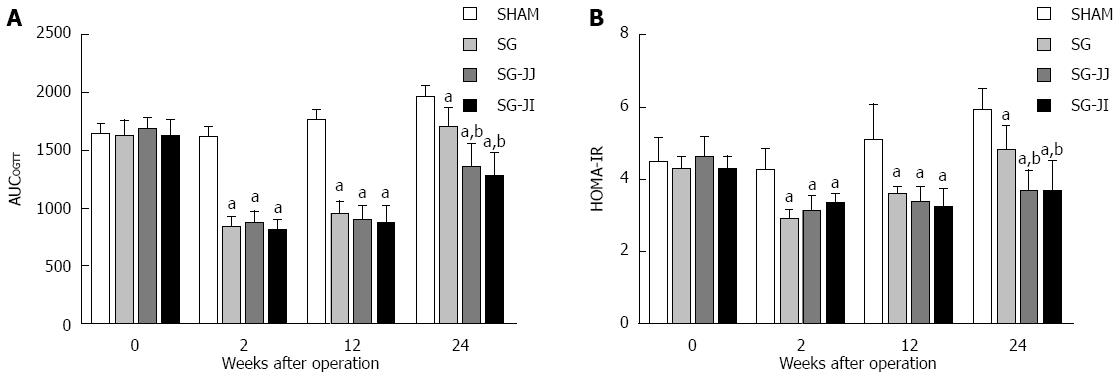
Figure 2 Area under the curve for the results of oral glucose tolerance test (A) and homeostasis model assessment of insulin resistance (B).
Area under the curve for the results of oral glucose tolerance test (AUCOGTT) and homeostasis model assessment of insulin resistance (HOMA-IR) were determined at baseline, and 2, 12 and 24 wk after surgery, and were analyzed by one-way ANOVA followed by Bonferroni post hoc comparison (aP < 0.05 vs SHAM; bP < 0.05 vs SG). SHAM: Sham-operated; SG: Sleeve gastrectomy; SG-JJ: SG with jejuno-jejunal loop; SG-JI: SG with jejuno-ileal loop.
- Citation: Zhong MW, Liu SZ, Zhang GY, Zhang X, Hu SY. Effects of sleeve gastrectomy with jejuno-jejunal or jejuno-ileal loop on glycolipid metabolism in diabetic rats. World J Gastroenterol 2016; 22(32): 7332-7341
- URL: https://www.wjgnet.com/1007-9327/full/v22/i32/7332.htm
- DOI: https://dx.doi.org/10.3748/wjg.v22.i32.7332


