Copyright
©The Author(s) 2016.
World J Gastroenterol. Aug 14, 2016; 22(30): 6925-6935
Published online Aug 14, 2016. doi: 10.3748/wjg.v22.i30.6925
Published online Aug 14, 2016. doi: 10.3748/wjg.v22.i30.6925
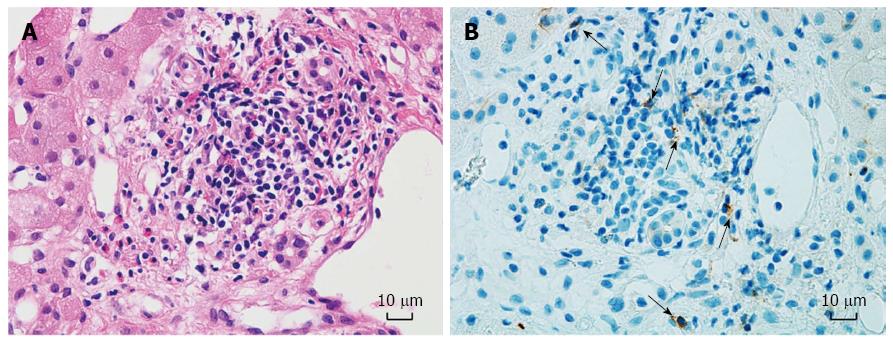
Figure 2 Liver biopsy pathology of case No.
12. Non-specific inflammation shown by H&E staining (A) (× 400). CD 56+ cells (black arrows) embedded in liver parenchyma (B) (× 400). The patient developed ITBL 23 d after the liver biopsy.
- Citation: Bang JB, Kim BW, Kim YB, Wang HJ, Lee HY, Sim J, Kim T, Lee KL, Hu XG, Mao W. Risk factor for ischemic-type biliary lesion after ABO-incompatible living donor liver transplantation. World J Gastroenterol 2016; 22(30): 6925-6935
- URL: https://www.wjgnet.com/1007-9327/full/v22/i30/6925.htm
- DOI: https://dx.doi.org/10.3748/wjg.v22.i30.6925


