Copyright
©The Author(s) 2016.
World J Gastroenterol. Jun 28, 2016; 22(24): 5479-5494
Published online Jun 28, 2016. doi: 10.3748/wjg.v22.i24.5479
Published online Jun 28, 2016. doi: 10.3748/wjg.v22.i24.5479
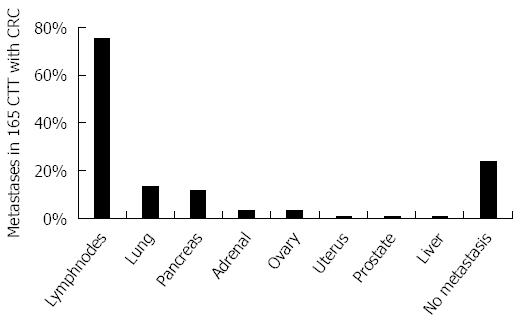
Figure 3 Schematic bar diagram depicting proportion of metastases in cotton top tamarin with colorectal cancer.
The bar diagram shows the distribution of metastasis based on the ORAU colony cancer statistics. The paucity of liver metastases is remarkable. CTT: Cotton top tamarin; CRC: Colorectal cancer.
- Citation: Tobi M, Thomas P, Ezekwudo D. Avoiding hepatic metastasis naturally: Lessons from the cotton top tamarin (Saguinus oedipus). World J Gastroenterol 2016; 22(24): 5479-5494
- URL: https://www.wjgnet.com/1007-9327/full/v22/i24/5479.htm
- DOI: https://dx.doi.org/10.3748/wjg.v22.i24.5479


