Copyright
©The Author(s) 2016.
World J Gastroenterol. Jun 21, 2016; 22(23): 5436-5444
Published online Jun 21, 2016. doi: 10.3748/wjg.v22.i23.5436
Published online Jun 21, 2016. doi: 10.3748/wjg.v22.i23.5436
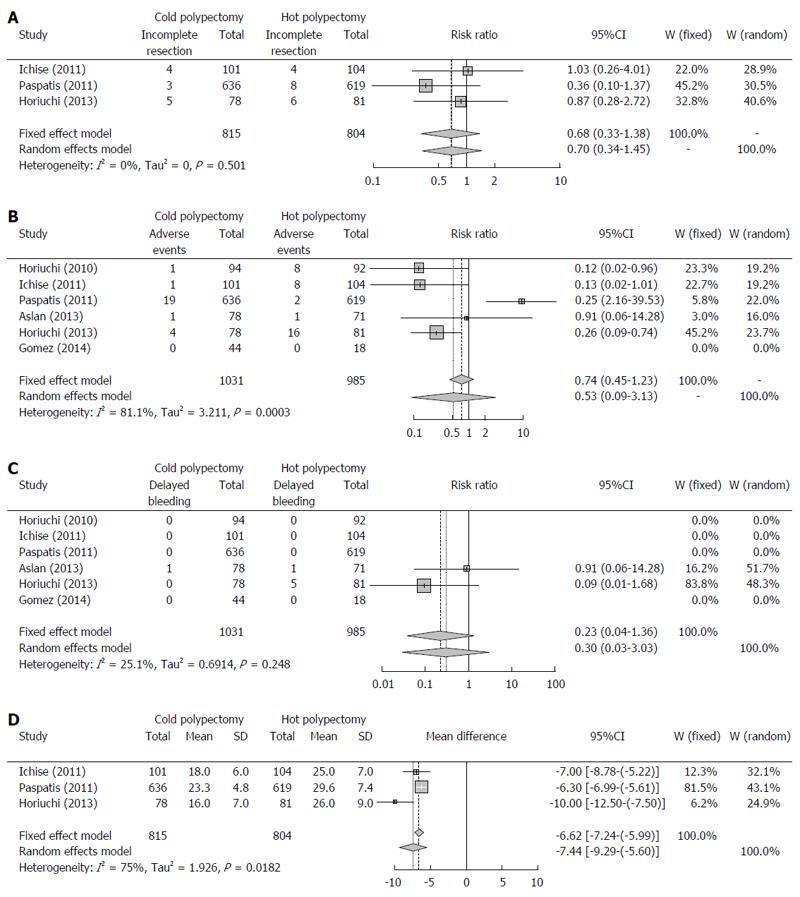
Figure 2 Forest plots were used to verify the relative strength of the diagnostic value of each procedure.
The results regarding the rates of incomplete resection (A), adverse events (B), delayed bleeding (C), and procedure duration (D) are shown. ESD: Endoscopic submucosal dissection; MD: Mean difference; SD: Standard deviation; CI: Confidence interval; W: Weight; OR: Odds ratio.
- Citation: Fujiya M, Sato H, Ueno N, Sakatani A, Tanaka K, Dokoshi T, Fujibayashi S, Nomura Y, Kashima S, Gotoh T, Sasajima J, Moriichi K, Watari J, Kohgo Y. Efficacy and adverse events of cold vs hot polypectomy: A meta-analysis. World J Gastroenterol 2016; 22(23): 5436-5444
- URL: https://www.wjgnet.com/1007-9327/full/v22/i23/5436.htm
- DOI: https://dx.doi.org/10.3748/wjg.v22.i23.5436


