Copyright
©The Author(s) 2016.
World J Gastroenterol. Jun 14, 2016; 22(22): 5237-5245
Published online Jun 14, 2016. doi: 10.3748/wjg.v22.i22.5237
Published online Jun 14, 2016. doi: 10.3748/wjg.v22.i22.5237
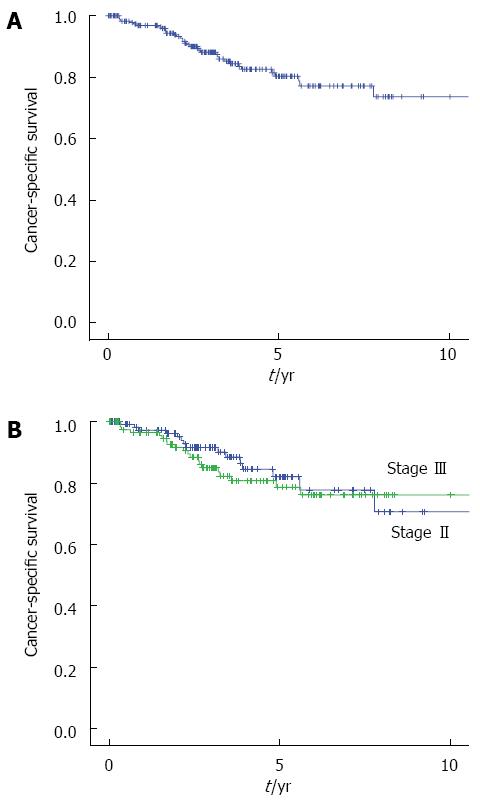
Figure 3 Kaplan-Meier curves showing the cancer-specific survival rates after primary tumor resection in patients with obstructive colorectal cancer.
A: All stage (n = 234); B: Stage II (n = 114, blue line), Stage III (n = 120, green line).
- Citation: Atsushi I, Mitsuyoshi O, Kazuya Y, Syuhei K, Noriyuki K, Masashi M, Akira W, Kentaro S, Nobuyuki K, Natsuko S, Jun W, Yasushi I, Chikara K, Itaru E. Long-term outcomes and prognostic factors of patients with obstructive colorectal cancer: A multicenter retrospective cohort study. World J Gastroenterol 2016; 22(22): 5237-5245
- URL: https://www.wjgnet.com/1007-9327/full/v22/i22/5237.htm
- DOI: https://dx.doi.org/10.3748/wjg.v22.i22.5237


