Copyright
©The Author(s) 2016.
World J Gastroenterol. Jun 14, 2016; 22(22): 5165-5172
Published online Jun 14, 2016. doi: 10.3748/wjg.v22.i22.5165
Published online Jun 14, 2016. doi: 10.3748/wjg.v22.i22.5165
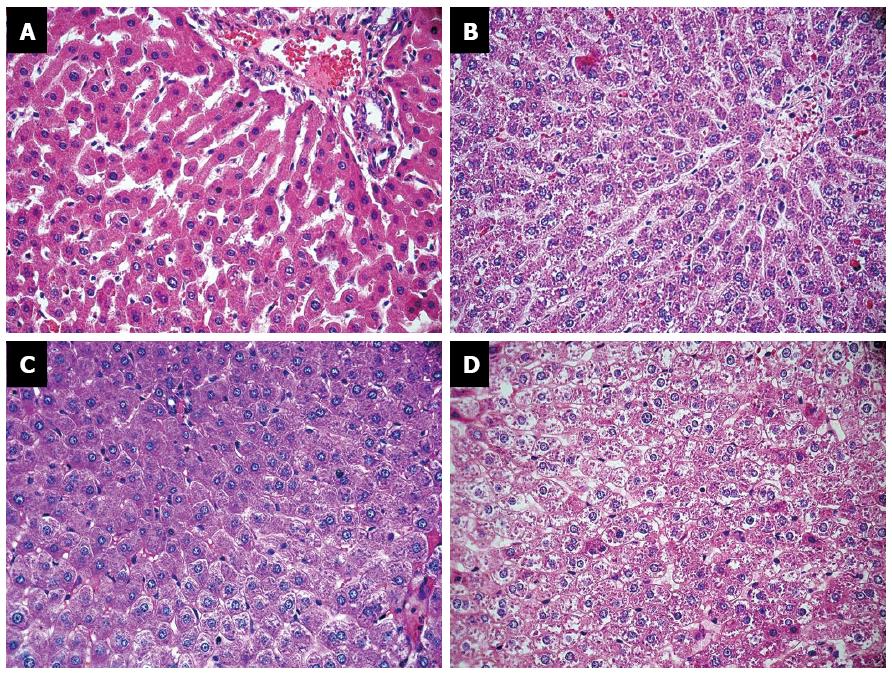
Figure 2 Staining of liver fragments at 8 wk: experimental diet group and control diet group.
A: Normal central vein, functional sinusoidal dilation, and small hepatocytes in the EDG (HE, original magnification 400 ×); B: Normal central vein, sinusoidal cells, and hepatocytes in the CDG (HE, original magnification 400 ×); C: Zones without glycogen in the EDG (HE, original magnification 400 ×); D: Homogeneous distribution of glycogen in the CDG (HE, original magnification 400 ×). EDG: Experimental diet group; CDG: Control diet group; HE: Hematoxylin and eosin.
- Citation: Monteiro MEL, Xavier AR, Oliveira FL, Filho PJ, Azeredo VB. Apoptosis induced by a low-carbohydrate and high-protein diet in rat livers. World J Gastroenterol 2016; 22(22): 5165-5172
- URL: https://www.wjgnet.com/1007-9327/full/v22/i22/5165.htm
- DOI: https://dx.doi.org/10.3748/wjg.v22.i22.5165


