Copyright
©The Author(s) 2016.
World J Gastroenterol. Jan 14, 2016; 22(2): 790-800
Published online Jan 14, 2016. doi: 10.3748/wjg.v22.i2.790
Published online Jan 14, 2016. doi: 10.3748/wjg.v22.i2.790
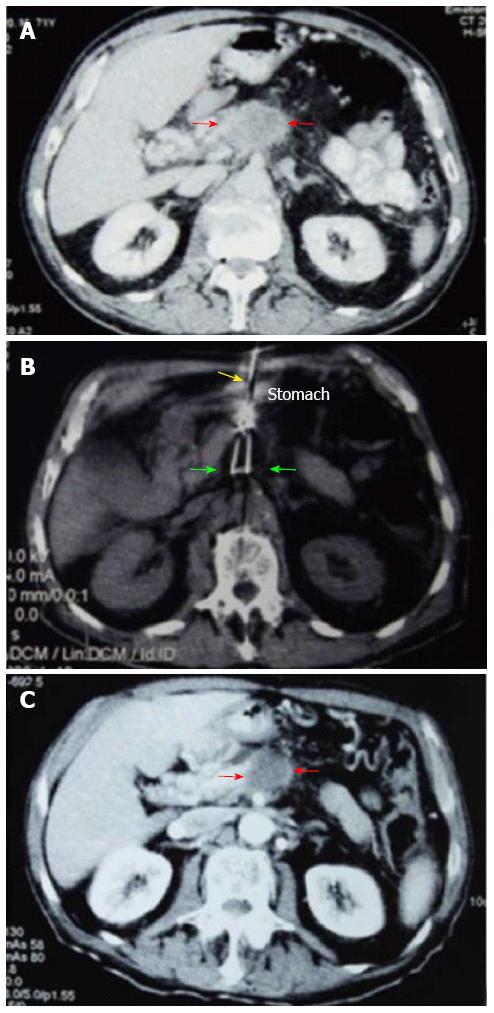
Figure 5 Comparisons between computed tomography images of pancreatic carcinoma before, during and 1.
5 mo after cryoablation. A: The tumor at stage IV (red arrows) is 4.5 cm × 4.6 cm × 3.8 cm in size; B: The cryoprobe was inserted via the stomach approaching the tumor mass (yellow arrow); cryoablation was performed after the pancreatic tumor was completely encased within the ice ball (green arrows); C: The center of the tumor mass (red arrows) 1.5 mo post-cryoablation displays shrinkage with no enhancement of the tumor.
- Citation: Luo XM, Niu LZ, Chen JB, Xu KC. Advances in cryoablation for pancreatic cancer. World J Gastroenterol 2016; 22(2): 790-800
- URL: https://www.wjgnet.com/1007-9327/full/v22/i2/790.htm
- DOI: https://dx.doi.org/10.3748/wjg.v22.i2.790


