Copyright
©The Author(s) 2016.
World J Gastroenterol. May 14, 2016; 22(18): 4515-4528
Published online May 14, 2016. doi: 10.3748/wjg.v22.i18.4515
Published online May 14, 2016. doi: 10.3748/wjg.v22.i18.4515
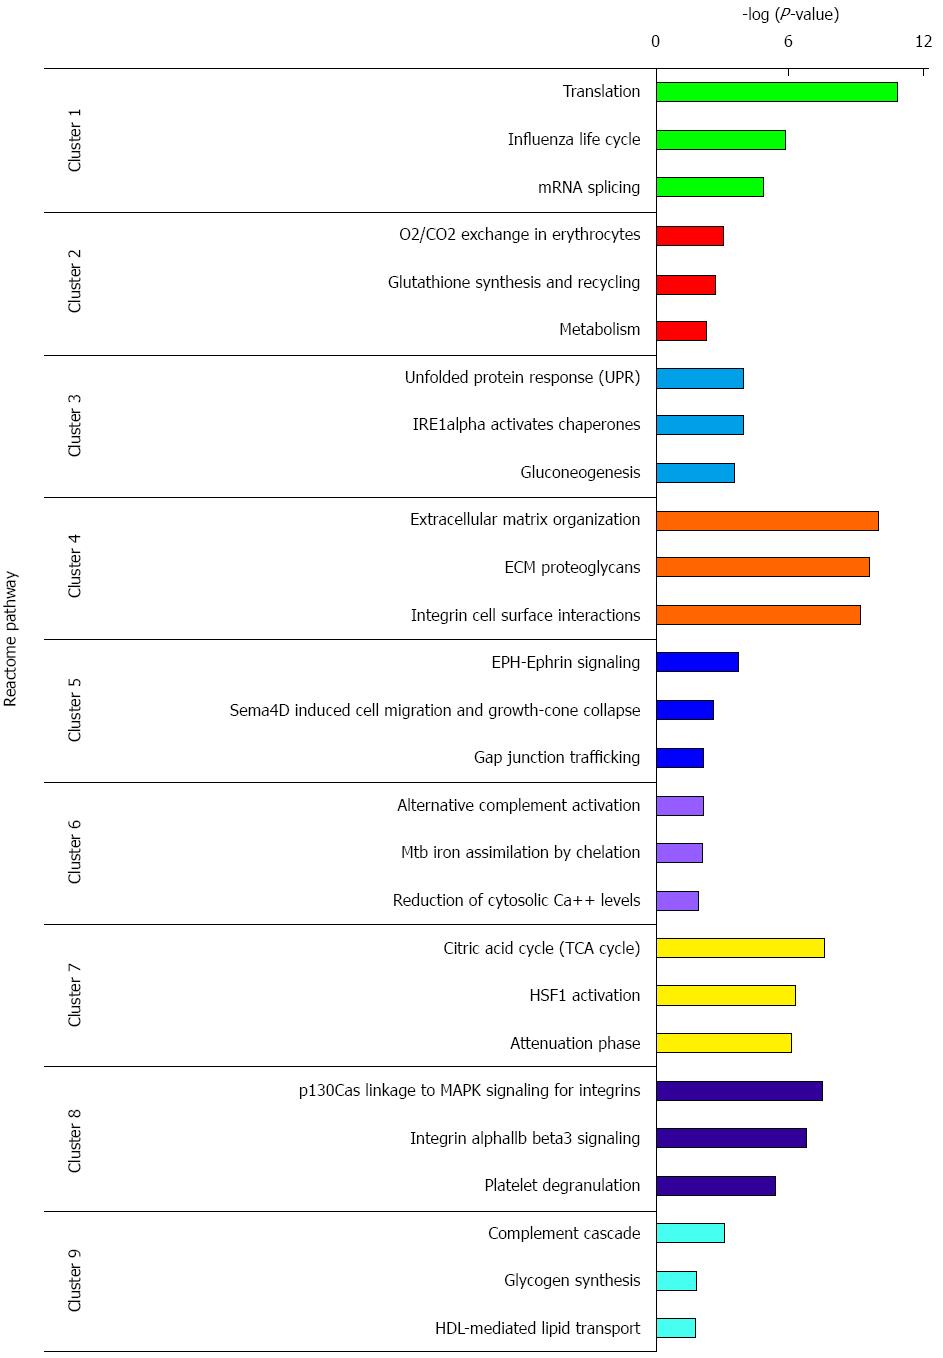
Figure 4 REACTOME pathway analysis of differential expressed proteins in each cluster.
Only top 3 significant pathways are presented. Each pathway is presented as negative logarithm of P-value.
- Citation: Peng F, Huang Y, Li MY, Li GQ, Huang HC, Guan R, Chen ZC, Liang SP, Chen YH. Dissecting characteristics and dynamics of differentially expressed proteins during multistage carcinogenesis of human colorectal cancer. World J Gastroenterol 2016; 22(18): 4515-4528
- URL: https://www.wjgnet.com/1007-9327/full/v22/i18/4515.htm
- DOI: https://dx.doi.org/10.3748/wjg.v22.i18.4515


