Copyright
©The Author(s) 2016.
World J Gastroenterol. May 7, 2016; 22(17): 4362-4372
Published online May 7, 2016. doi: 10.3748/wjg.v22.i17.4362
Published online May 7, 2016. doi: 10.3748/wjg.v22.i17.4362
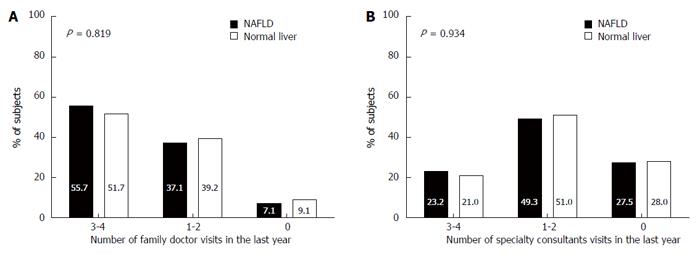
Figure 5 Comparison between non-alcoholic fatty liver disease and normal liver groups in the distribution of frequency of family doctor visits (A) and in the distribution of frequency of specialty consultants (B).
NAFLD: Non-alcoholic fatty liver disease.
- Citation: Mlynarsky L, Schlesinger D, Lotan R, Webb M, Halpern Z, Santo E, Shibolet O, Zelber-Sagi S. Non-alcoholic fatty liver disease is not associated with a lower health perception. World J Gastroenterol 2016; 22(17): 4362-4372
- URL: https://www.wjgnet.com/1007-9327/full/v22/i17/4362.htm
- DOI: https://dx.doi.org/10.3748/wjg.v22.i17.4362


