Copyright
©The Author(s) 2016.
World J Gastroenterol. Apr 28, 2016; 22(16): 4149-4159
Published online Apr 28, 2016. doi: 10.3748/wjg.v22.i16.4149
Published online Apr 28, 2016. doi: 10.3748/wjg.v22.i16.4149
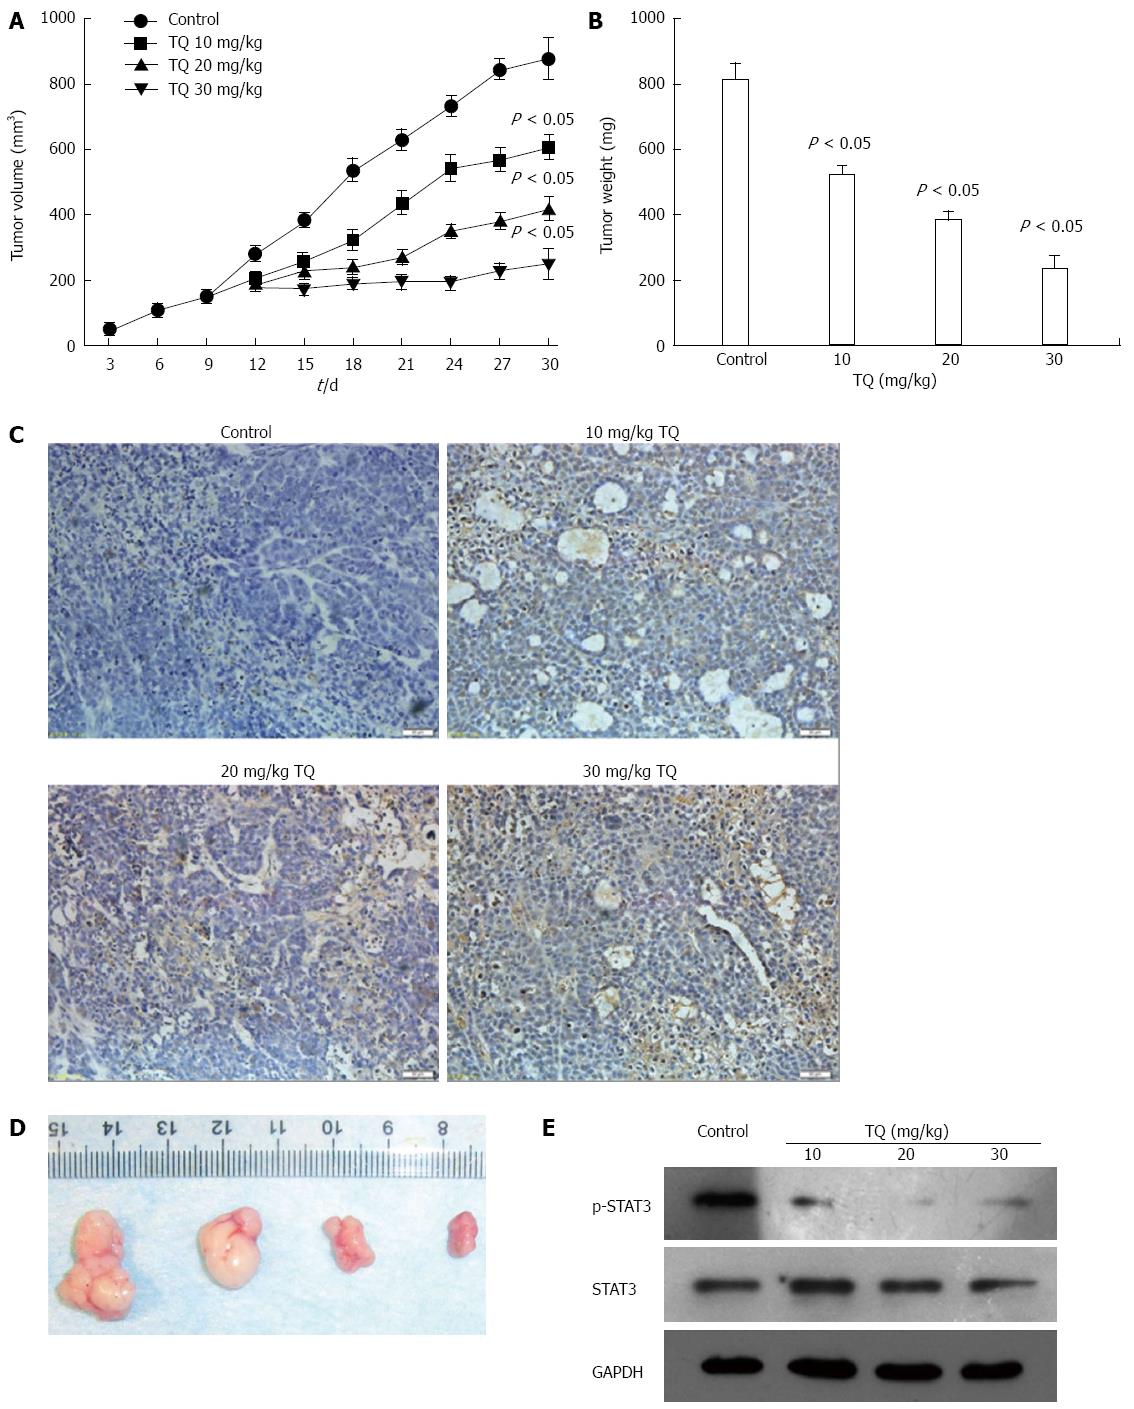
Figure 6 Thymoquinone inhibits tumor growth in a gastric mouse xenograft model.
A: Tumor volumes of the xenograft tumors derived from 0, 25, 50, or 75 μmol/L TQ group. Each time point represents the mean tumor volume for each group; B: Tumor weight was obtained at the end of the experiment. Error bars represent the standard error of the mean ± SD; C: Detection of apoptotic cells in tumor tissue by TUNEL assay. Control: equal-volume physiologic saline; Treatment group: different doses of TQ: 10 mg/kg TQ; 20 mg/kg TQ; 30 mg/kg TQ; all therapies were administered three times per week via intraperitoneal injection. The brown color indicating apoptotic signals is shown by the arrows. Scale bar represents 50 mL. Original magnification: 400 ×; D: Photographs of tumors from control and TQ treatment groups. From left to right: control group, 10 mg/kg TQ; 20 mg/kg TQ; 30 mg/kg TQ group; E: TQ suppresses phosphor-STAT3 in vivo. The tumor tissue extracts were prepared, after which Western blotting was performed. The same blots were stripped and reprobed with the GAPDH antibody to verify equal protein loading. TQ: Thymoquinone; TUNEL: TdT-mediated dUTP-biotin nick end-labeling.
- Citation: Zhu WQ, Wang J, Guo XF, Liu Z, Dong WG. Thymoquinone inhibits proliferation in gastric cancer via the STAT3 pathway in vivo and in vitro. World J Gastroenterol 2016; 22(16): 4149-4159
- URL: https://www.wjgnet.com/1007-9327/full/v22/i16/4149.htm
- DOI: https://dx.doi.org/10.3748/wjg.v22.i16.4149


