Copyright
©The Author(s) 2016.
World J Gastroenterol. Apr 14, 2016; 22(14): 3829-3836
Published online Apr 14, 2016. doi: 10.3748/wjg.v22.i14.3829
Published online Apr 14, 2016. doi: 10.3748/wjg.v22.i14.3829
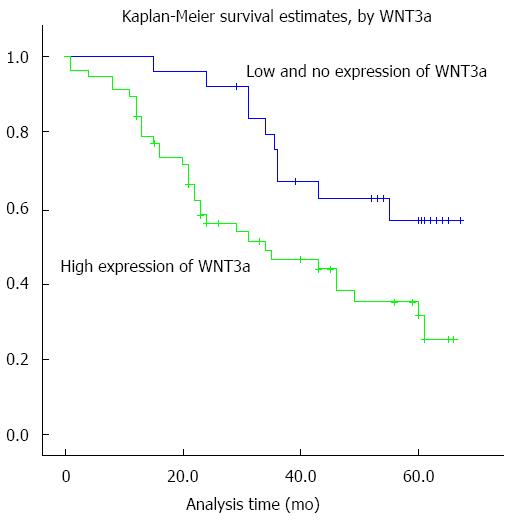
Figure 3 Overall survival curves of 80 hepatocellular carcinoma patients.
The Wnt3a expression curves were calculated by the Kaplan-Meier method. Survival curves of 80 hepatocellular carcinoma patients were made according to cancerous tissues expressing a low or high level of Wnt3a (log-rank test, P < 0.001). The green line is the high Wnt3a group; and the blue line is the low or without Wnt3a group.
- Citation: Pan LH, Yao M, Cai Y, Gu JJ, Yang XL, Wang L, Yao DF. Oncogenic Wnt3a expression as an estimable prognostic marker for hepatocellular carcinoma. World J Gastroenterol 2016; 22(14): 3829-3836
- URL: https://www.wjgnet.com/1007-9327/full/v22/i14/3829.htm
- DOI: https://dx.doi.org/10.3748/wjg.v22.i14.3829


