Copyright
©The Author(s) 2016.
World J Gastroenterol. Mar 28, 2016; 22(12): 3441-3450
Published online Mar 28, 2016. doi: 10.3748/wjg.v22.i12.3441
Published online Mar 28, 2016. doi: 10.3748/wjg.v22.i12.3441
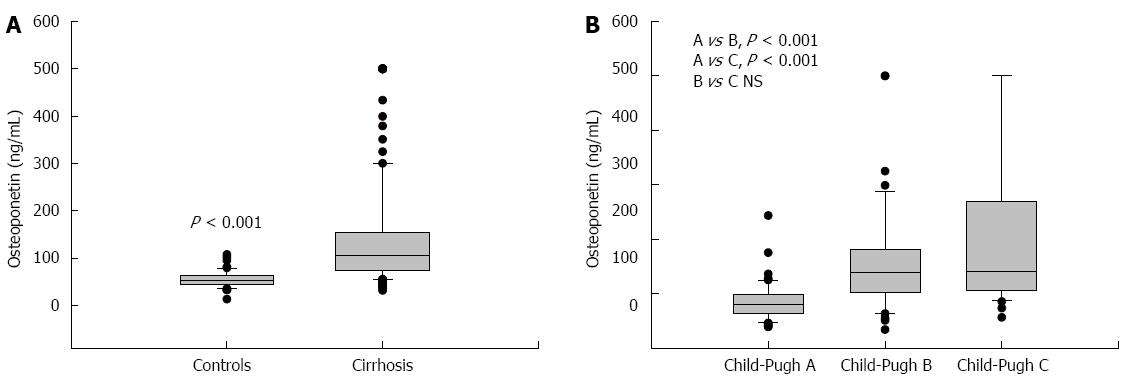
Figure 1 Plasma osteopontin in patients with cirrhosis and controls (A) and in patients with cirrhosis in Child-Pugh A, B, and C classes (B).
Box-plot graphs, boxes correspond to the median value and interquartile range.
- Citation: Bruha R, Jachymova M, Petrtyl J, Dvorak K, Lenicek M, Urbanek P, Svestka T, Vitek L. Osteopontin: A non-invasive parameter of portal hypertension and prognostic marker of cirrhosis. World J Gastroenterol 2016; 22(12): 3441-3450
- URL: https://www.wjgnet.com/1007-9327/full/v22/i12/3441.htm
- DOI: https://dx.doi.org/10.3748/wjg.v22.i12.3441


