Copyright
©The Author(s) 2016.
World J Gastroenterol. Mar 28, 2016; 22(12): 3341-3354
Published online Mar 28, 2016. doi: 10.3748/wjg.v22.i12.3341
Published online Mar 28, 2016. doi: 10.3748/wjg.v22.i12.3341
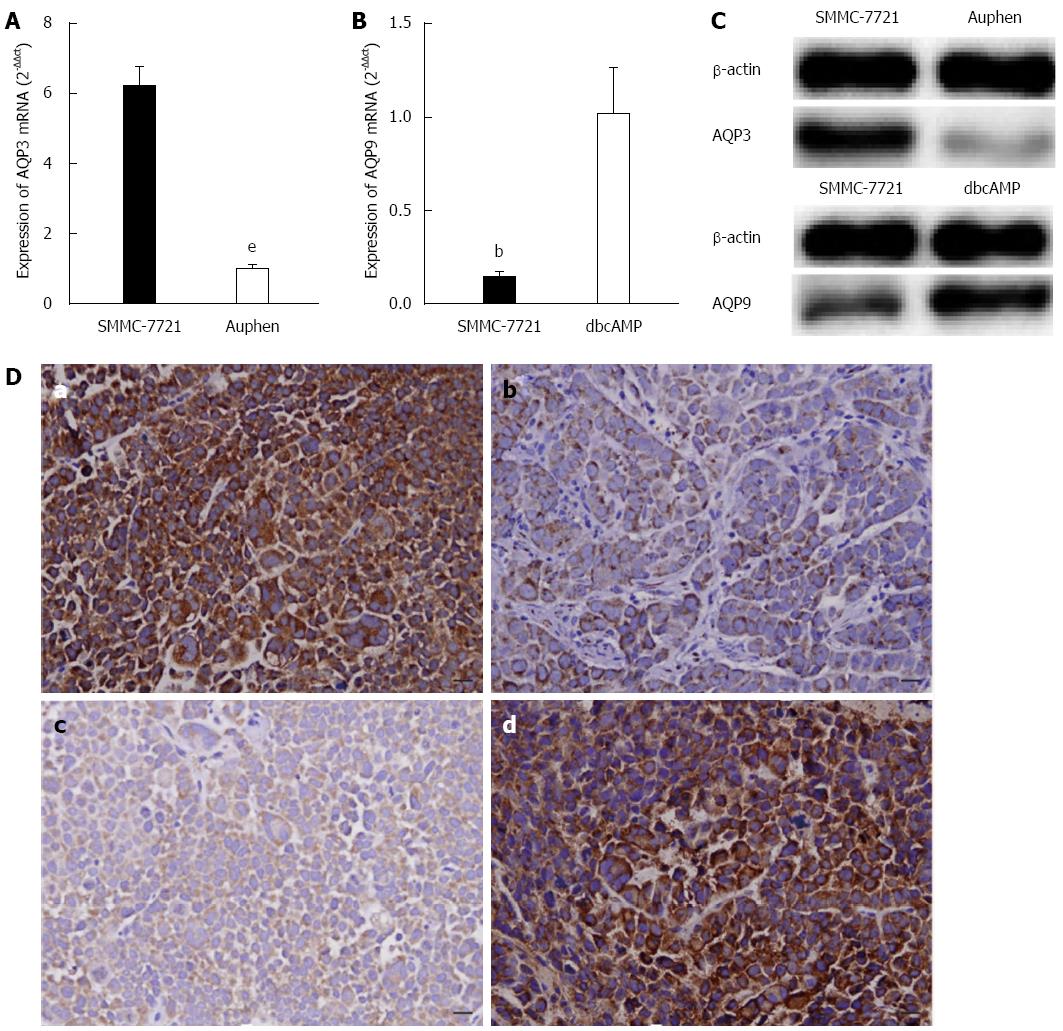
Figure 5 Effects of Auphen and dibutyryl cAMP on AQP3 and AQP9 expression.
A: mRNA levels of AQP3 in tumors from nude mice; B: mRNA levels of AQP9 in tumors from nude mice; C: Protein levels of AQP3 and AQP9 in tumors from nude mice; D: Immunohistochemical analysis of a subcutaneous tumor: a: Analysis of AQP3 expression in the control group; b: Analysis of AQP3 expression in the Auphen group; c: Analysis of AQP9 expression in the control group; d: Analysis of AQP9 expression in the dbcAMP group. (magnification × 200, bar = 50 μm). All data represent the mean ± SD (n = 3). bP < 0.01 vs the control; eP < 0.001 vs the control. dbcAMP: Dibutyryl cAMP.
- Citation: Peng R, Zhao GX, Li J, Zhang Y, Shen XZ, Wang JY, Sun JY. Auphen and dibutyryl cAMP suppress growth of hepatocellular carcinoma by regulating expression of aquaporins 3 and 9 in vivo. World J Gastroenterol 2016; 22(12): 3341-3354
- URL: https://www.wjgnet.com/1007-9327/full/v22/i12/3341.htm
- DOI: https://dx.doi.org/10.3748/wjg.v22.i12.3341


