Copyright
©The Author(s) 2015.
World J Gastroenterol. Feb 21, 2015; 21(7): 2047-2057
Published online Feb 21, 2015. doi: 10.3748/wjg.v21.i7.2047
Published online Feb 21, 2015. doi: 10.3748/wjg.v21.i7.2047
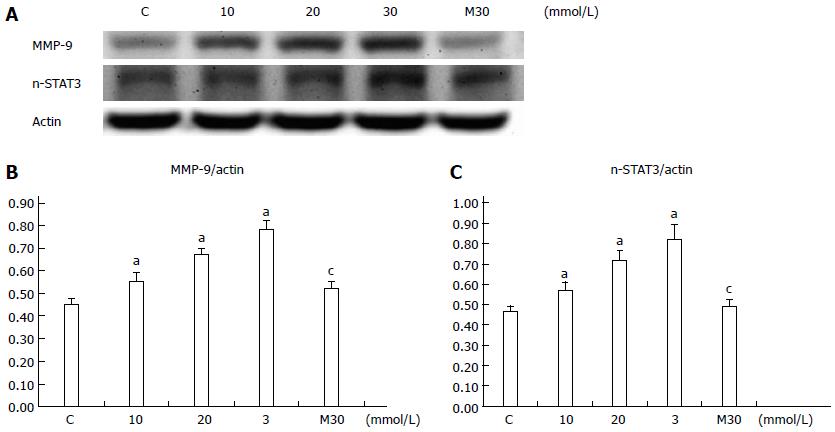
Figure 8 Effect of glucose on matrix metalloproteinase-9 and signal transducer and activator of transcription 3 expression.
The expression of both matrix metalloproteinase-9 (MMP-9) (A, B) and n-signal transducer and activator of transcription 3 (STAT3) (A, C) proteins were dose-dependently and significantly higher than in the C (control) group. In the M30 group (treated with 30 mmol/L of mannitol), neither MMP-9 nor n-STAT3 expression was significantly higher than in the C (control) group. aP < 0.05 vs the control group; cP > 0.05 vs the control group. n = 6 per group. C: Control; 0 mmol/L; M30: Mannitol; 30 mmol/L.
- Citation: Lin CY, Lee CH, Huang CC, Lee ST, Guo HR, Su SB. Impact of high glucose on metastasis of colon cancer cells. World J Gastroenterol 2015; 21(7): 2047-2057
- URL: https://www.wjgnet.com/1007-9327/full/v21/i7/2047.htm
- DOI: https://dx.doi.org/10.3748/wjg.v21.i7.2047


