Copyright
©The Author(s) 2015.
World J Gastroenterol. Dec 28, 2015; 21(48): 13480-13489
Published online Dec 28, 2015. doi: 10.3748/wjg.v21.i48.13480
Published online Dec 28, 2015. doi: 10.3748/wjg.v21.i48.13480
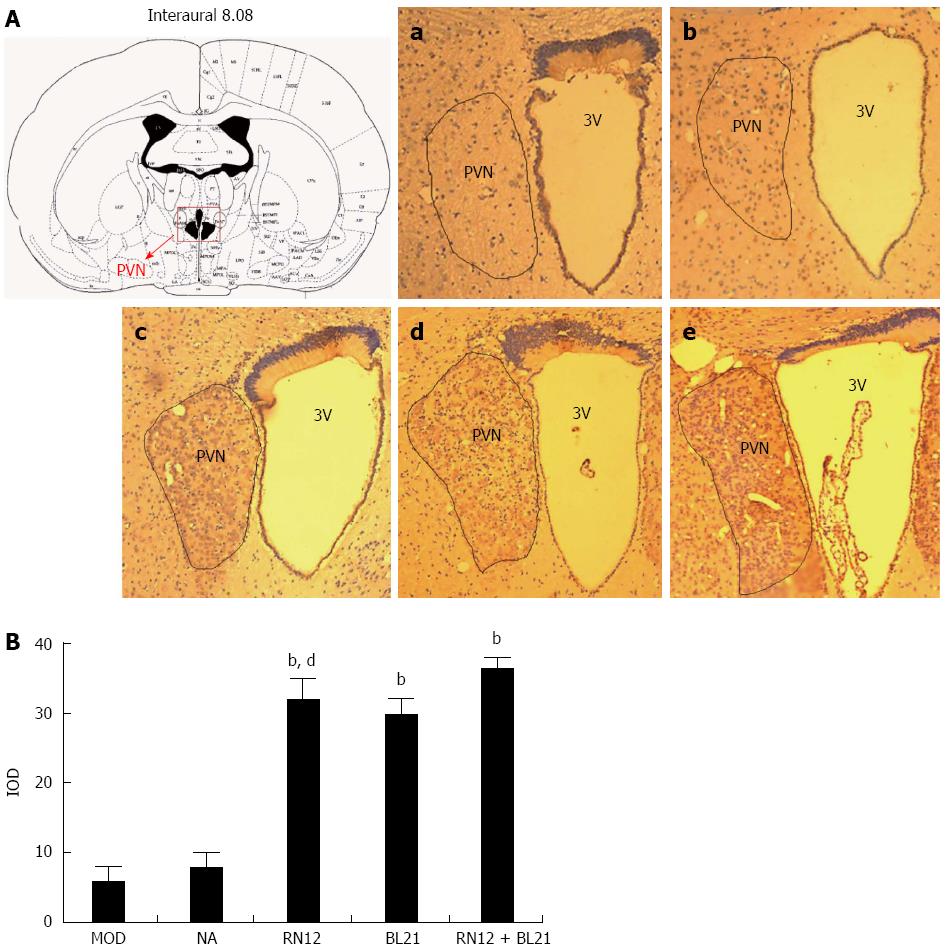
Figure 3 c-fos expression in the paraventricular hypothalamic nucleus.
A: Photomicrographs of the hypothalamus sections showing Fos immunoreactivity in the paraventricular hypothalamic nucleus (PVN). Lane a: Model group; Lane b: Non-acupoint group; Lane c: BL21 group; Lane d: RN12 group; Lane e: RN12 + BL21 group. The anatomic locations of the photomicrographs are indicated at the top, adapted from the atlas of Paxinos and Watson. Fos-positive neurons are presented as dark brown staining in the cell nuclei; B: Integral optical density (IOD) of Fos-positive neurons in the PVN (bP < 0.01 vs the MOD group; dP < 0.01 vs the RN12 + BL21 group). 3 V: Third ventricle.
- Citation: Wang H, Liu WJ, Shen GM, Zhang MT, Huang S, He Y. Neural mechanism of gastric motility regulation by electroacupuncture at RN12 and BL21: A paraventricular hypothalamic nucleus-dorsal vagal complex-vagus nerve-gastric channel pathway. World J Gastroenterol 2015; 21(48): 13480-13489
- URL: https://www.wjgnet.com/1007-9327/full/v21/i48/13480.htm
- DOI: https://dx.doi.org/10.3748/wjg.v21.i48.13480


