Copyright
©The Author(s) 2015.
World J Gastroenterol. Dec 7, 2015; 21(45): 12778-12786
Published online Dec 7, 2015. doi: 10.3748/wjg.v21.i45.12778
Published online Dec 7, 2015. doi: 10.3748/wjg.v21.i45.12778
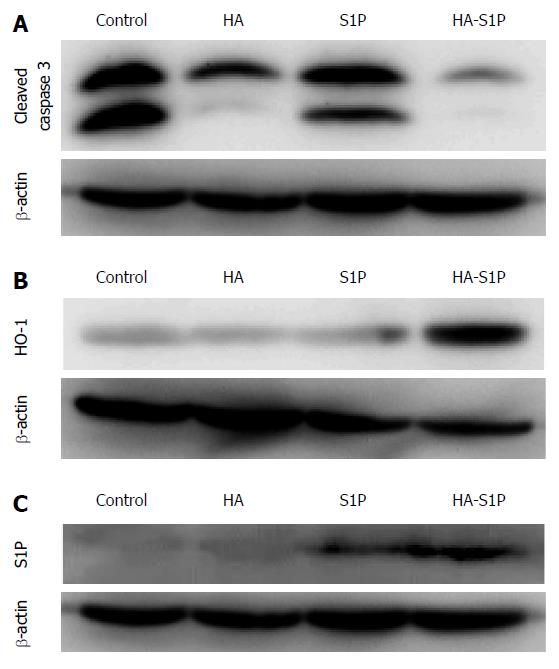
Figure 4 Western blot analysis of cleaved caspase-3 (A), heme oxygenase-1 (B) and sphingosine 1-phosphate (C) in liver tissues.
The expression of cleaved caspase-3 in the control, HA, and S1P groups, was higher than that in the HA-S1P group. The expression of HO-1 in the HA-S1P group was higher than that in the control, HA, and S1P group. The expression of S1P in the HA-S1P group was higher than in the control, HA, or S1P groups. HO-1: Heme oxygenase 1; HA: Hyaluronic acid; S1P: Sphingosine 1-phosphate.
- Citation: Sano N, Tamura T, Toriyabe N, Nowatari T, Nakayama K, Tanoi T, Murata S, Sakurai Y, Hyodo M, Fukunaga K, Harashima H, Ohkohchi N. New drug delivery system for liver sinusoidal endothelial cells for ischemia-reperfusion injury. World J Gastroenterol 2015; 21(45): 12778-12786
- URL: https://www.wjgnet.com/1007-9327/full/v21/i45/12778.htm
- DOI: https://dx.doi.org/10.3748/wjg.v21.i45.12778


