Copyright
©The Author(s) 2015.
World J Gastroenterol. Nov 7, 2015; 21(41): 11609-11620
Published online Nov 7, 2015. doi: 10.3748/wjg.v21.i41.11609
Published online Nov 7, 2015. doi: 10.3748/wjg.v21.i41.11609
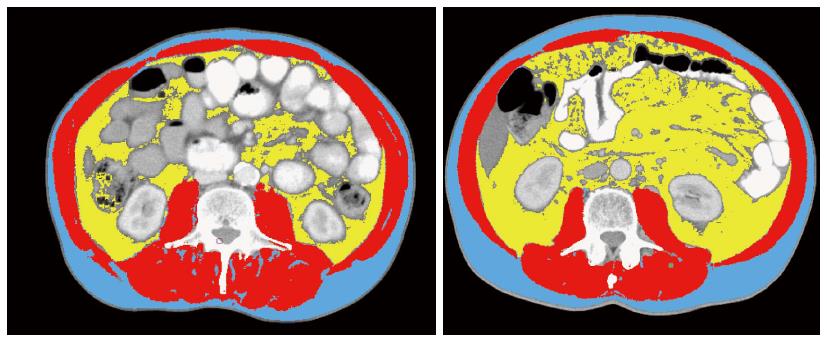
Figure 2 Lumbar computed tomography was analyzed for muscle and fat tissue cross sectional areas using an appropriate software developed by Martin et al[88].
Muscle mass is shown in red and were quantified within a Hounsfield unit (HU) range of -29-150, visceral fat shown in yellow, range from -150 to -50, and subcutaneous fat shown in blue, range from -190 to 30. Muscle radiation attenuation was calculated for muscle area. Although these two images might refer to two individuals with the same body mass index (23 kg/m2) and age (73 yr), the amount of muscle mass and visceral fat, which amplifies inflammatory response, are very distinct.
- Citation: Cravo M, Fidalgo C, Garrido R, Rodrigues T, Luz G, Palmela C, Santos M, Lopes F, Maio R. Towards curative therapy in gastric cancer: Faraway, so close! World J Gastroenterol 2015; 21(41): 11609-11620
- URL: https://www.wjgnet.com/1007-9327/full/v21/i41/11609.htm
- DOI: https://dx.doi.org/10.3748/wjg.v21.i41.11609


