Copyright
©The Author(s) 2015.
World J Gastroenterol. Oct 14, 2015; 21(38): 10853-10865
Published online Oct 14, 2015. doi: 10.3748/wjg.v21.i38.10853
Published online Oct 14, 2015. doi: 10.3748/wjg.v21.i38.10853
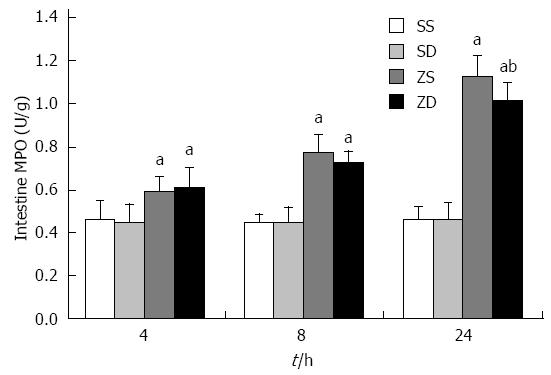
Figure 2 Activity of intestinal myeloperoxidase.
Data are expressed as mean ± SD. aP < 0.05 vs group SS and group SD, bP < 0.05 vs group ZS (n = 8 per group at each time point). MPO: Myeloperoxidase; DMSO: Dimethyl sulfoxide; SS: Sham with administration of normal saline; SD: Sham with administration of DMSO; ZS: Zymosan with administration of normal saline; ZD: Zymosan with administration of DMSO.
- Citation: Li YM, Wang HB, Zheng JG, Bai XD, Zhao ZK, Li JY, Hu S. Dimethyl sulfoxide inhibits zymosan-induced intestinal inflammation and barrier dysfunction. World J Gastroenterol 2015; 21(38): 10853-10865
- URL: https://www.wjgnet.com/1007-9327/full/v21/i38/10853.htm
- DOI: https://dx.doi.org/10.3748/wjg.v21.i38.10853


