Copyright
©The Author(s) 2015.
World J Gastroenterol. Sep 21, 2015; 21(35): 10104-10112
Published online Sep 21, 2015. doi: 10.3748/wjg.v21.i35.10104
Published online Sep 21, 2015. doi: 10.3748/wjg.v21.i35.10104
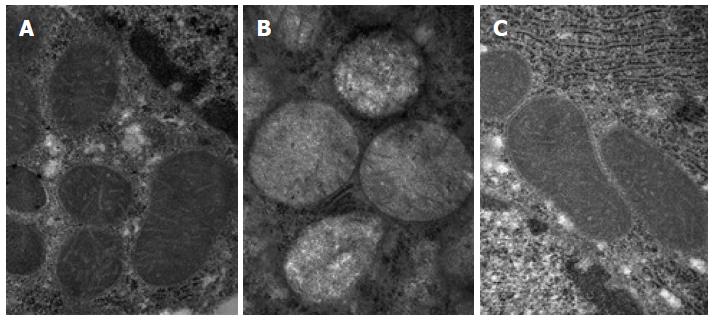
Figure 2 Electron microscopy of liver mitochondria of each group (magnification × 80000).
A: Normal group; B: Model group; C: Treatment group.
- Citation: Wang YC, Kong WZ, Jin QM, Chen J, Dong L. Effects of salvianolic acid B on liver mitochondria of rats with nonalcoholic steatohepatitis. World J Gastroenterol 2015; 21(35): 10104-10112
- URL: https://www.wjgnet.com/1007-9327/full/v21/i35/10104.htm
- DOI: https://dx.doi.org/10.3748/wjg.v21.i35.10104


