Copyright
©The Author(s) 2015.
World J Gastroenterol. Sep 14, 2015; 21(34): 9957-9965
Published online Sep 14, 2015. doi: 10.3748/wjg.v21.i34.9957
Published online Sep 14, 2015. doi: 10.3748/wjg.v21.i34.9957
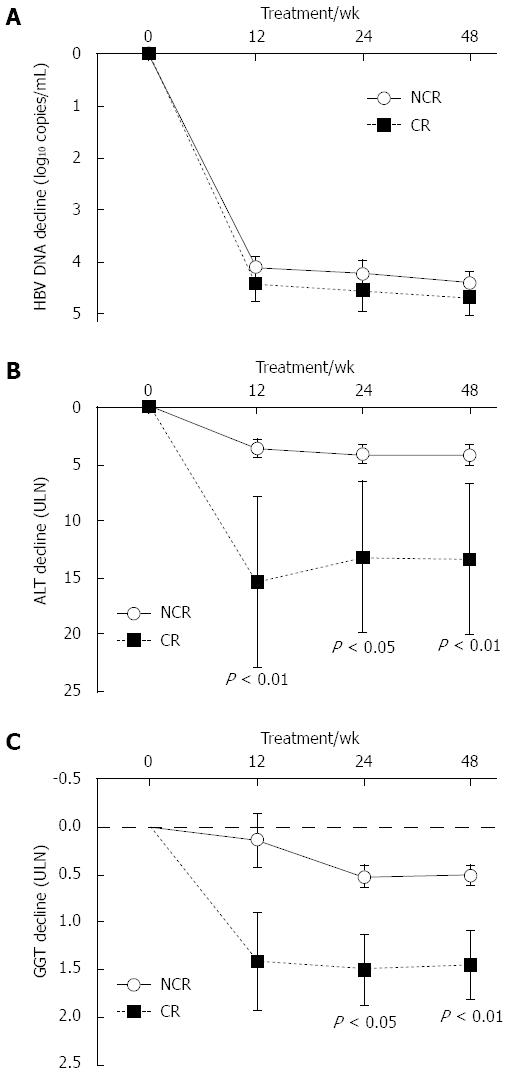
Figure 3 Decline of serum alanine aminotransferase and gamma-glutamyl transferase from baseline differs between complete response and non-complete response groups after 48 wk of treatment.
Decline of serum levels for A: HBV DNA; B: ALT; C: GGT plotted as a function of time. Data are shown as the mean ± SE. ALT: Alanine aminotransferase; CR: Complete response; GGT: Gamma-glutamyl transferase; HBV: Hepatitis B virus; NCR: Non-complete response; ULN: Upper limit of normal.
- Citation: Huang R, Yang CC, Liu Y, Xia J, Su R, Xiong YL, Wang GY, Sun ZH, Yan XM, Lu S, Wu C. Association of serum gamma-glutamyl transferase with treatment outcome in chronic hepatitis B patients. World J Gastroenterol 2015; 21(34): 9957-9965
- URL: https://www.wjgnet.com/1007-9327/full/v21/i34/9957.htm
- DOI: https://dx.doi.org/10.3748/wjg.v21.i34.9957


