Copyright
©The Author(s) 2015.
World J Gastroenterol. Sep 14, 2015; 21(34): 9945-9956
Published online Sep 14, 2015. doi: 10.3748/wjg.v21.i34.9945
Published online Sep 14, 2015. doi: 10.3748/wjg.v21.i34.9945
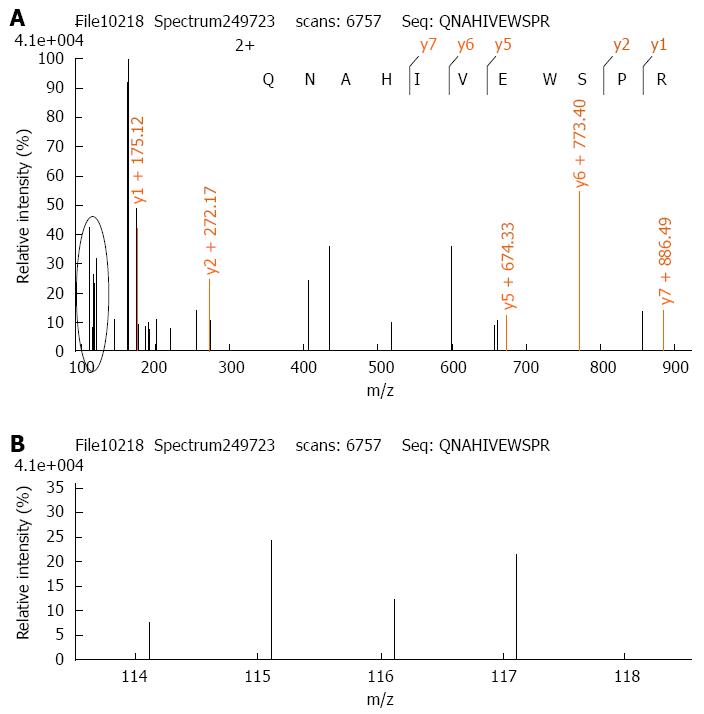
Figure 4 MS/MS spectrum showing the peptides from PAK1IP1 (peptide sequence: QNAHIVEWSPR) (A) and relative quantification of PAK1IP1 expression in the indicated conditions (B).
Different protein samples from SGC7901 cells labeled with iTRAQ reagents as follows: control-114 tag, β-elemene treated-115 tag, IR-116 tag, β-elemene combined with IR-117 tag. The relative intensity indicates the relative abundance of PAK1IP1 expression in different conditions.
- Citation: Liu JS, Che XM, Chang S, Qiu GL, He SC, Fan L, Zhao W, Zhang ZL, Wang SF. β-elemene enhances the radiosensitivity of gastric cancer cells by inhibiting Pak1 activation. World J Gastroenterol 2015; 21(34): 9945-9956
- URL: https://www.wjgnet.com/1007-9327/full/v21/i34/9945.htm
- DOI: https://dx.doi.org/10.3748/wjg.v21.i34.9945


