Copyright
©The Author(s) 2015.
World J Gastroenterol. Sep 7, 2015; 21(33): 9808-9816
Published online Sep 7, 2015. doi: 10.3748/wjg.v21.i33.9808
Published online Sep 7, 2015. doi: 10.3748/wjg.v21.i33.9808
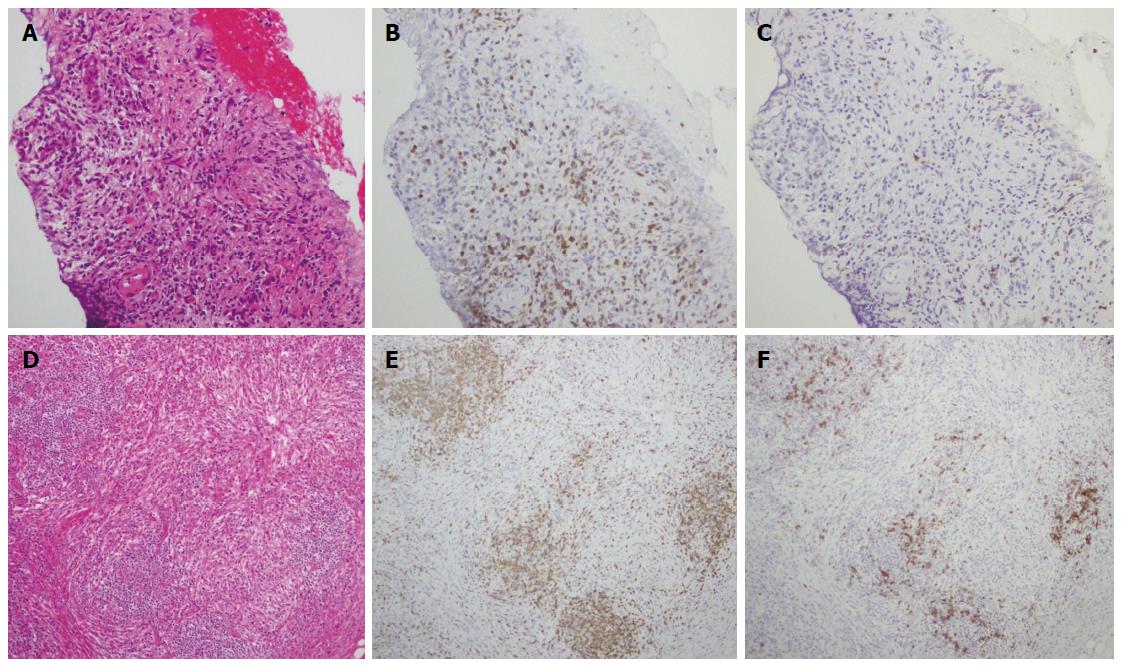
Figure 8 Histological findings of pancreas and salivary gland specimens.
Pancreas and salivary gland tissues exhibited increased CD3-positive T cell infiltration compared with CD20-positive B cell infiltration. A-C: Pancreas (magnification × 100); D-F: salivary gland (magnification × 100); A, D: Hematoxylin and eosin staining; B, C, E, F: Immunohistochemical staining for CD38 (B, E) and CD20 (C, F).
- Citation: Nakano E, Kanno A, Masamune A, Yoshida N, Hongo S, Miura S, Takikawa T, Hamada S, Kume K, Kikuta K, Hirota M, Nakayama K, Fujishima F, Shimosegawa T. IgG4-unrelated type 1 autoimmune pancreatitis. World J Gastroenterol 2015; 21(33): 9808-9816
- URL: https://www.wjgnet.com/1007-9327/full/v21/i33/9808.htm
- DOI: https://dx.doi.org/10.3748/wjg.v21.i33.9808


