Copyright
©The Author(s) 2015.
World J Gastroenterol. Aug 28, 2015; 21(32): 9577-9587
Published online Aug 28, 2015. doi: 10.3748/wjg.v21.i32.9577
Published online Aug 28, 2015. doi: 10.3748/wjg.v21.i32.9577
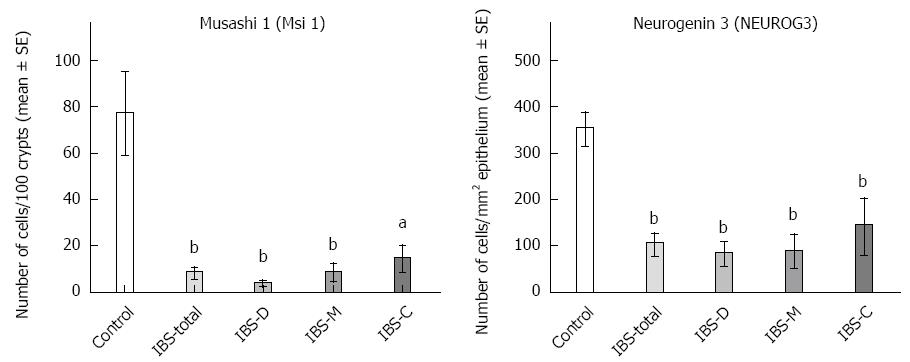
Figure 1 Densities of musashi 1 and neurogenin 3 cells in controls and irritable bowel syndrome-total, irritable bowel syndrome-C, irritable bowel syndrome-D and irritable bowel syndrome-M patients.
aP < 0.05, bP < 0.001 vs the control group.
- Citation: El-Salhy M, Hatlebakk JG, Hausken T. Reduction in duodenal endocrine cells in irritable bowel syndrome is associated with stem cell abnormalities. World J Gastroenterol 2015; 21(32): 9577-9587
- URL: https://www.wjgnet.com/1007-9327/full/v21/i32/9577.htm
- DOI: https://dx.doi.org/10.3748/wjg.v21.i32.9577


