Copyright
©The Author(s) 2015.
World J Gastroenterol. Jan 21, 2015; 21(3): 878-887
Published online Jan 21, 2015. doi: 10.3748/wjg.v21.i3.878
Published online Jan 21, 2015. doi: 10.3748/wjg.v21.i3.878
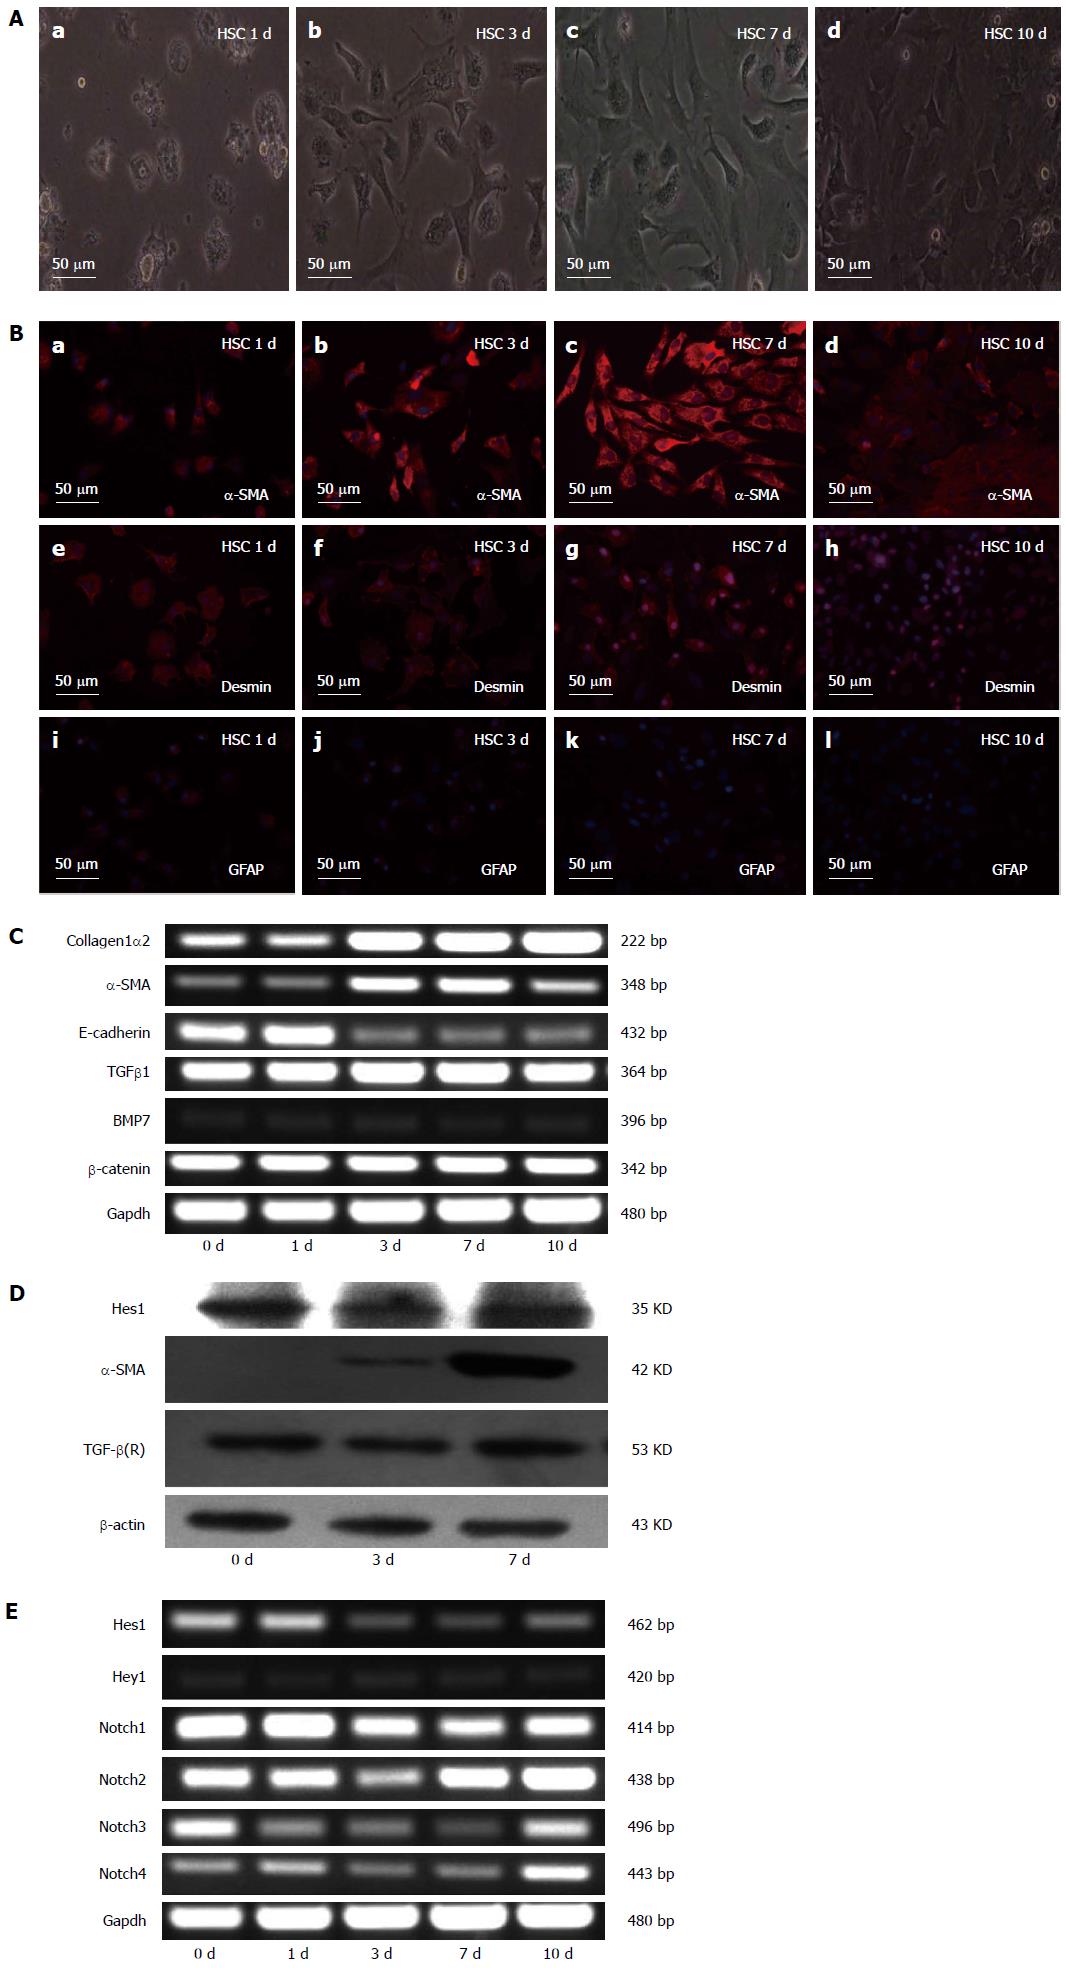
Figure 1 Characteristics of quiescent and activated hepatic stellate cells.
A: Microscopic pictures of freshly isolated hepatic stellate cells (HSCs) after 1, 3, 7 and 10 d of culture; B: The expression of α-smooth muscle actin (α-SMA), desmin and GFAP detected by immunofluorescence staining. Red fluorescence represents α-SMA in pictures a, b, c, and d; desmin in pictures e, f, g, and h; and GFAP in pictures i, j, k, and l. The cell nuclei were visualized by DAPI (4, 6-diamidino-2-phenylindole) staining (blue). C: Expression analysis of collagen1α2, α-SMA, E-cadherin, transforming growth factor-β1 (TGFβ1), bone morphogenetic protein-7 (BMP7), and β-catenin in the cells in (A) measured by RT-PCR. RT-PCR of Gapdh served as a control; D: Analysis of α-SMA, Hes1 and TGF-β (R) by Western blotting of the cells in (A). The β-actin protein served as a control; E: RT-PCR analysis of Notch receptors (Notch1-4) and the Notch target genes Hes1 and Hey1. Notably, the data for Hes1 in D and E do not agree with each other.
-
Citation: Zhang K, Zhang YQ, Ai WB, Hu QT, Zhang QJ, Wan LY, Wang XL, Liu CB, Wu JF.
Hes1 , an important gene for activation of hepatic stellate cells, is regulated by Notch1 and TGF-β/BMP signaling. World J Gastroenterol 2015; 21(3): 878-887 - URL: https://www.wjgnet.com/1007-9327/full/v21/i3/878.htm
- DOI: https://dx.doi.org/10.3748/wjg.v21.i3.878


