Copyright
©The Author(s) 2015.
World J Gastroenterol. Jan 21, 2015; 21(3): 868-877
Published online Jan 21, 2015. doi: 10.3748/wjg.v21.i3.868
Published online Jan 21, 2015. doi: 10.3748/wjg.v21.i3.868
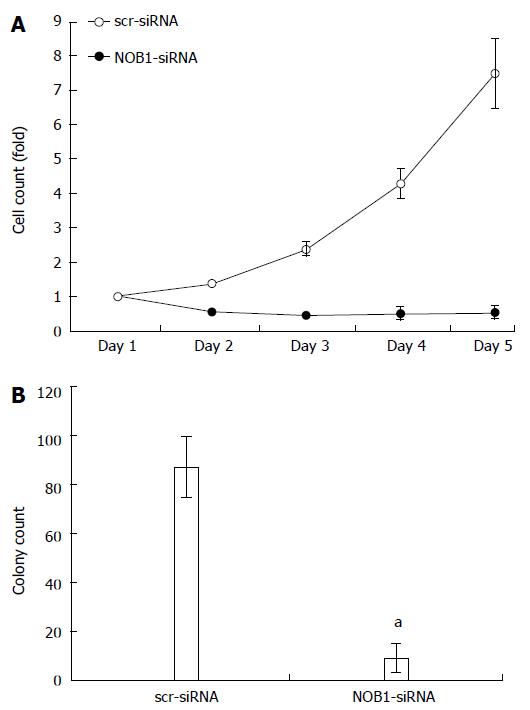
Figure 2 Effect of NOB1 knockdown on cell growth in RKO cells.
A: The infected cells expressing GFP were imaged and counted using the Cellomics ArrayScanTM High Content Screening (HCS) Reader once a day for 5 d. Cell growth curves in scr-siRNA and NOB1-siRNA infected RKO cells are shown; B: Cell growth was detected by the colony formation assay in RKO cells 14 d after infection of scr-siRNA and NOB1-siRNA cells. RKO cells were seeded at 500 cells/well and allowed to form colonies. Cell colonies were imaged and counted using the Cellomics ArrayScanTM HCS Reader. Data are presented as mean ± SD of three independent experiments. aP < 0.05 vs scr-siRNA. scr-siRNA: Cells infected with lentivirus-mediated scramble small interfering RNA; NOB1-siRNA: Cells infected with lentivirus-mediated NOB1-siRNA; GFP: Green fluorescent protein; qRT-PCR: Quantitative reverse transcription polymerase chain reaction.
- Citation: He XW, Feng T, Yin QL, Jian YW, Liu T. NOB1 is essential for the survival of RKO colorectal cancer cells. World J Gastroenterol 2015; 21(3): 868-877
- URL: https://www.wjgnet.com/1007-9327/full/v21/i3/868.htm
- DOI: https://dx.doi.org/10.3748/wjg.v21.i3.868


