Copyright
©The Author(s) 2015.
World J Gastroenterol. Jan 21, 2015; 21(3): 854-861
Published online Jan 21, 2015. doi: 10.3748/wjg.v21.i3.854
Published online Jan 21, 2015. doi: 10.3748/wjg.v21.i3.854
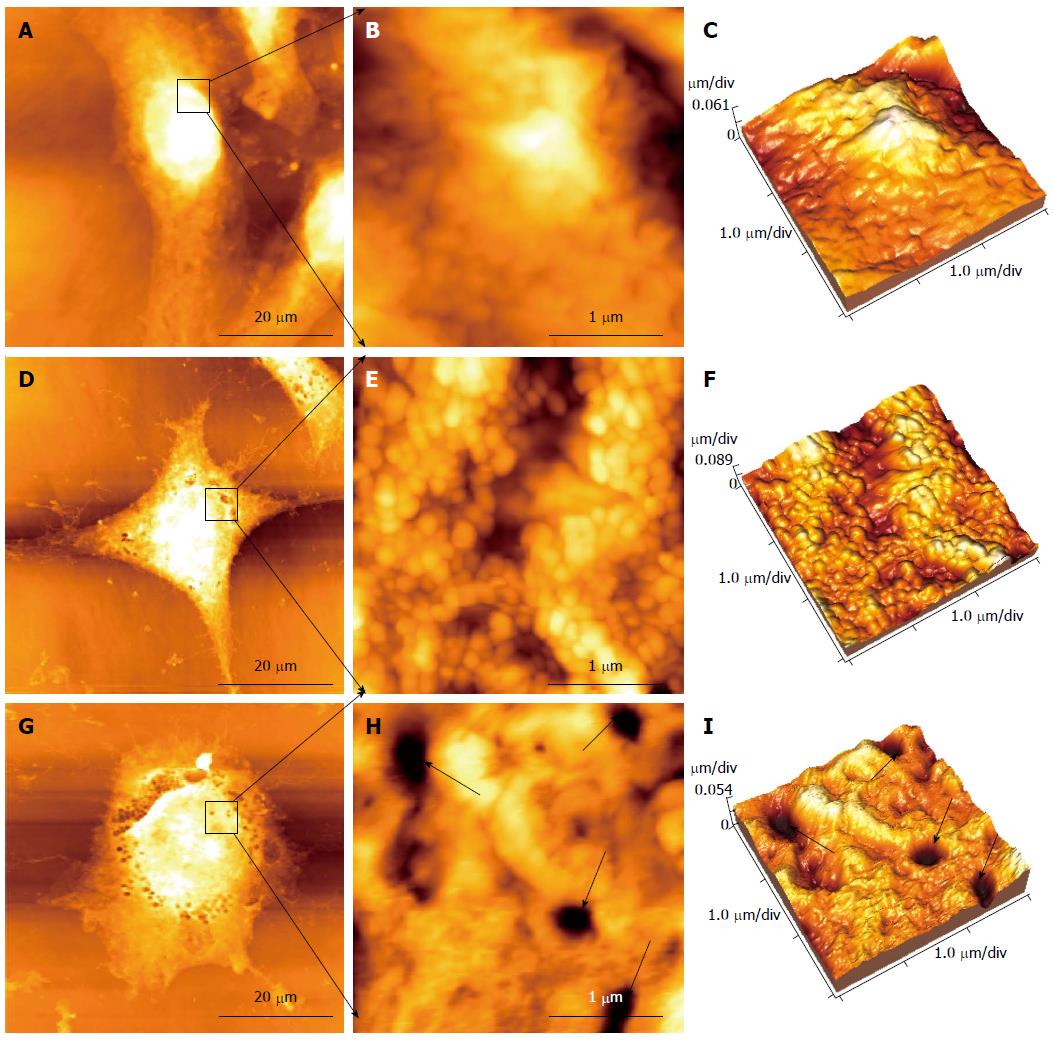
Figure 4 Changes in morphology and ultrastructure of HepG2 cells detected by atomic force microscopy.
A-C: Control HepG2 cells; D-F: HepG2 cells treated with 0.05 mg/mL cinobufacini for 48 h; G-I: HepG2 cells treated with 0.1 mg/mL cinobufacini for 48 h; A, D and G: Morphology of HepG2 cells (60 μm × 60 μm); B, E and H: Ultrastructure images (3 μm × 3 μm) on corresponding cell region indicated by black frame; C, F and I: Corresponding 3D images of ultrastructure in B, E and H. Black arrows: Some pores in the cell membrane.
- Citation: Wu Q, Lin WD, Liao GQ, Zhang LG, Wen SQ, Lin JY. Antiproliferative effects of cinobufacini on human hepatocellular carcinoma HepG2 cells detected by atomic force microscopy. World J Gastroenterol 2015; 21(3): 854-861
- URL: https://www.wjgnet.com/1007-9327/full/v21/i3/854.htm
- DOI: https://dx.doi.org/10.3748/wjg.v21.i3.854


