Copyright
©The Author(s) 2015.
World J Gastroenterol. Jan 21, 2015; 21(3): 836-853
Published online Jan 21, 2015. doi: 10.3748/wjg.v21.i3.836
Published online Jan 21, 2015. doi: 10.3748/wjg.v21.i3.836
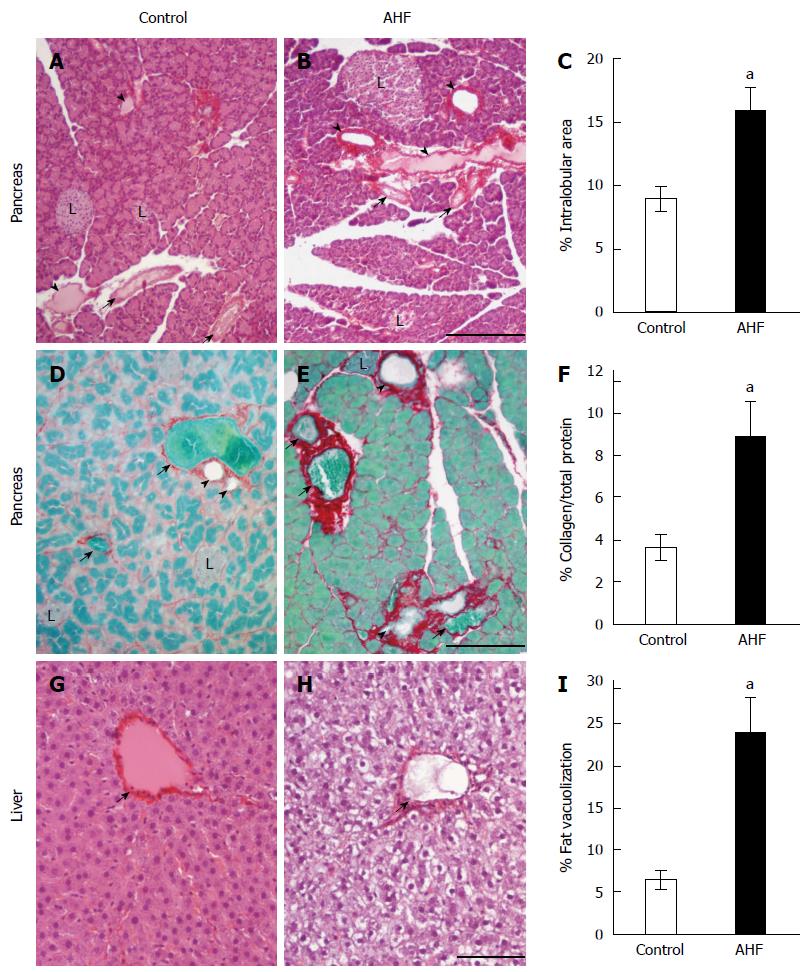
Figure 1 Histopathological analysis of the effects of alcohol and high fat diet fat diet on pancreas and liver.
A: Micrograph of pancreas from a control regular chow fed rat stained with hematoxylin and eosin (HE); B: Micrograph of pancreas from an alcohol and high fat diet (AHF) fed rat stained with HE; C: Quantification of intralobular spaces (area percentage) determined there was a significant increase in pancreata from AHF fed rats; D: Micrograph of pancreas from a control rat fed regular chow with Sirius red stained collagen fibrosis and fast green counterstain; E: Micrograph of pancreas from an AHF fed rat with Sirius red stained collagen fibrosis and fast green counterstain; F: Quantification of extracellular collagen deposits (stained red) as a percent of total tissue area. A significant increase in collagen staining was detected in pancreata of AHF fed rats; G: Micrograph of liver from a control rat fed regular chow stained with HE; H: Micrograph of liver from an AHF fed rat stained with HE; I: Quantification of intracellular fat vacuolization (area percentage). Unstained areas are fat vacuoles that were significantly increased in liver samples from AHF fed rats. aP < 0.05, AHF vs control. L: Islet of Langerhans; Solid arrow head: Pancreatic duct; Small arrow: Blood vessel. A, B: Scalebar 50 μm; D, E: Scalebar 100 μm; G, H: Scalebar 100 μm.
- Citation: McIlwrath SL, Westlund KN. Pharmacological attenuation of chronic alcoholic pancreatitis induced hypersensitivity in rats. World J Gastroenterol 2015; 21(3): 836-853
- URL: https://www.wjgnet.com/1007-9327/full/v21/i3/836.htm
- DOI: https://dx.doi.org/10.3748/wjg.v21.i3.836


