Copyright
©The Author(s) 2015.
World J Gastroenterol. Jul 21, 2015; 21(27): 8314-8325
Published online Jul 21, 2015. doi: 10.3748/wjg.v21.i27.8314
Published online Jul 21, 2015. doi: 10.3748/wjg.v21.i27.8314
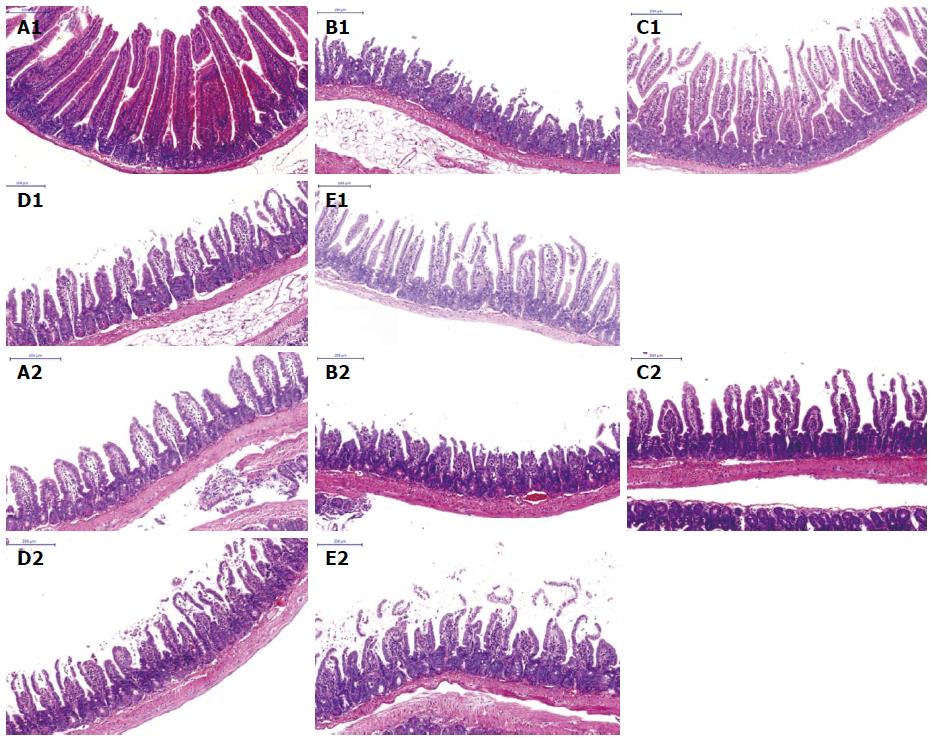
Figure 4 Hematoxylin and eosin staining of the jejunum and ileum in all groups (magnification × 100).
Representative images from jejunum (A1-E1) and ileum (A2-E2). A: Sham group; B: Control group; C: Anti-high-mobility group protein 1 group; D: Anti-myeloid differentiation gene 88 group; E: Anti-translocating-chain-associating membrane protein group (magnification × 100; scale bars = 200 μm).
- Citation: Wang J, He GZ, Wang YK, Zhu QK, Chen W, Guo T. TLR4-HMGB1-, MyD88- and TRIF-dependent signaling in mouse intestinal ischemia/reperfusion injury. World J Gastroenterol 2015; 21(27): 8314-8325
- URL: https://www.wjgnet.com/1007-9327/full/v21/i27/8314.htm
- DOI: https://dx.doi.org/10.3748/wjg.v21.i27.8314


