Copyright
©The Author(s) 2015.
World J Gastroenterol. Jul 21, 2015; 21(27): 8314-8325
Published online Jul 21, 2015. doi: 10.3748/wjg.v21.i27.8314
Published online Jul 21, 2015. doi: 10.3748/wjg.v21.i27.8314
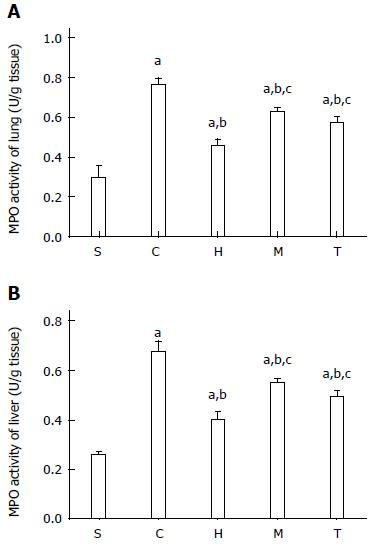
Figure 2 Levels of myeloperoxidase activity in the lung and liver.
S: Sham group; C: Control group; H: Anti-high-mobility group protein 1 group; M: Anti-myeloid differentiation gene 88 group; T: Anti-translocating-chain-associating membrane protein group; n = 4; aP < 0.05 vs sham group; bP < 0.05 vs control group; cP < 0.05 vs anti-HMGB1 group. MPO: Myeloperoxidase.
- Citation: Wang J, He GZ, Wang YK, Zhu QK, Chen W, Guo T. TLR4-HMGB1-, MyD88- and TRIF-dependent signaling in mouse intestinal ischemia/reperfusion injury. World J Gastroenterol 2015; 21(27): 8314-8325
- URL: https://www.wjgnet.com/1007-9327/full/v21/i27/8314.htm
- DOI: https://dx.doi.org/10.3748/wjg.v21.i27.8314


