Copyright
©The Author(s) 2015.
World J Gastroenterol. Jul 14, 2015; 21(26): 8043-8051
Published online Jul 14, 2015. doi: 10.3748/wjg.v21.i26.8043
Published online Jul 14, 2015. doi: 10.3748/wjg.v21.i26.8043
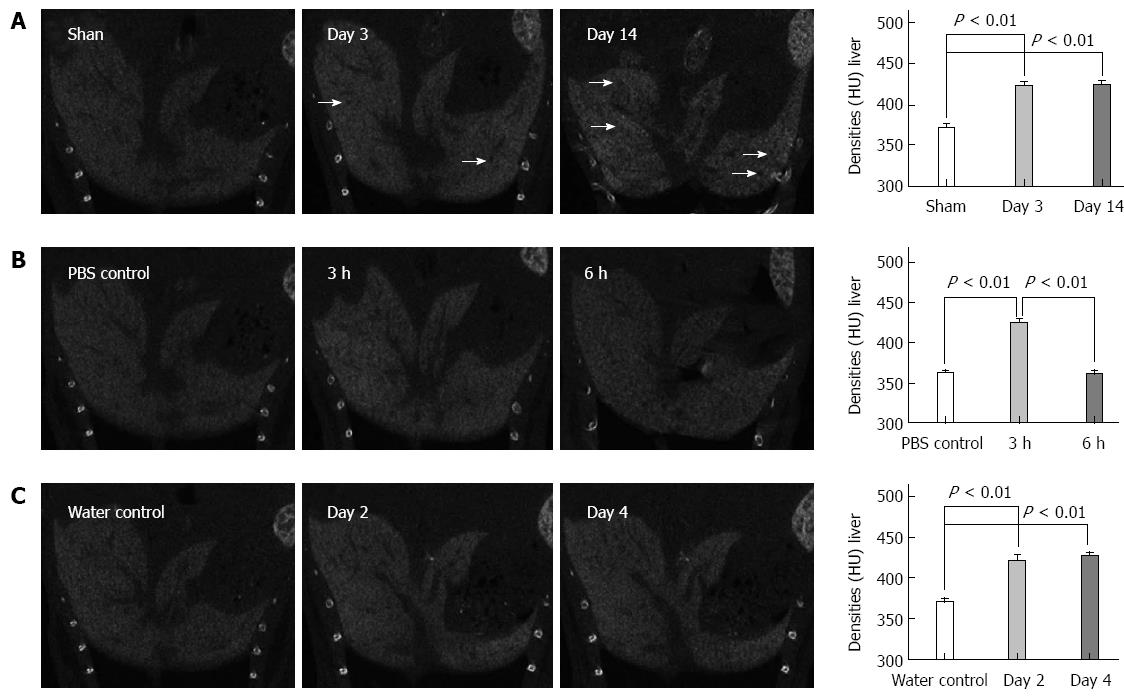
Figure 2 Contrast-enhanced computed tomography images of liver lesions induced by bile duct ligation (A), lipopolysaccharide/D-GalN (B) and alcohol (C); density measured in the livers are reported as HU.
The black arrows indicate black regions with low densities. Values are represented as the means of triplicate values and presented as the mean ± SD.
- Citation: Hua XW, Lu TF, Li DW, Wang WG, Li J, Liu ZZ, Lin WW, Zhang JJ, Xia Q. Contrast-enhanced micro-computed tomography using ExiTron nano6000 for assessment of liver injury. World J Gastroenterol 2015; 21(26): 8043-8051
- URL: https://www.wjgnet.com/1007-9327/full/v21/i26/8043.htm
- DOI: https://dx.doi.org/10.3748/wjg.v21.i26.8043


