Copyright
©The Author(s) 2015.
World J Gastroenterol. Jul 7, 2015; 21(25): 7742-7753
Published online Jul 7, 2015. doi: 10.3748/wjg.v21.i25.7742
Published online Jul 7, 2015. doi: 10.3748/wjg.v21.i25.7742
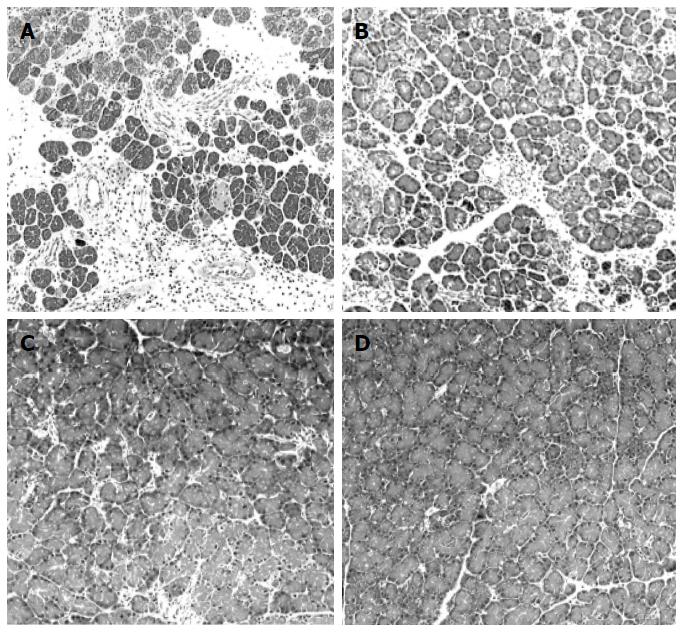
Figure 3 Representative photomicrographs of the pancreas in the four different treatment groups on day 12 after induction of acute pancreatitis.
A: The pancreas of AP-C rat (ad libitum feeding with saline administration) showed destruction of pancreatic acini, tubular complexes and marked infiltration of inflammatory cells, mainly lymphocytes; B: The pancreas of AP-R rat (pancreatic rest) showed minimal histologic alterations with atrophic pancreatic acini and mild inflammatory cell infiltration; The pancreas in AP-S (C) (pancreatic stimulation) and AP-R/S rats (D) (pancreatic rest for the first 5 d followed by pancreatic stimulation for 5 d) showed almost normal architecture. Original magnification × 25. AP: Acute pancreatitis.
- Citation: Jia D, Yamamoto M, Otsuki M. Effect of endogenous cholecystokinin on the course of acute pancreatitis in rats. World J Gastroenterol 2015; 21(25): 7742-7753
- URL: https://www.wjgnet.com/1007-9327/full/v21/i25/7742.htm
- DOI: https://dx.doi.org/10.3748/wjg.v21.i25.7742


