Copyright
©The Author(s) 2015.
World J Gastroenterol. Jun 28, 2015; 21(24): 7545-7552
Published online Jun 28, 2015. doi: 10.3748/wjg.v21.i24.7545
Published online Jun 28, 2015. doi: 10.3748/wjg.v21.i24.7545
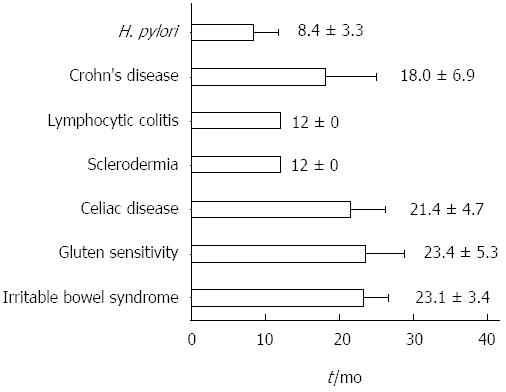
Figure 2 Histogram showing the mean ± SD time, expressed in months, taken to make a final diagnosis during the follow-up.
ANOVA plus Bonferroni analysis showed that the mean follow-up time was CD = GS = IBS = Crohn > H. pylori = scleroderma = lymphocytic colitis. CD: Celiac disease; GS: Gluten sensitivity; IBS: Irritable bowel syndrome; H. pylori: Helicobacter pylori.
- Citation: Losurdo G, Piscitelli D, Giangaspero A, Principi M, Buffelli F, Giorgio F, Montenegro L, Sorrentino C, Amoruso A, Ierardi E, Di Leo A. Evolution of nonspecific duodenal lymphocytosis over 2 years of follow-up. World J Gastroenterol 2015; 21(24): 7545-7552
- URL: https://www.wjgnet.com/1007-9327/full/v21/i24/7545.htm
- DOI: https://dx.doi.org/10.3748/wjg.v21.i24.7545


