Copyright
©The Author(s) 2015.
World J Gastroenterol. Jun 28, 2015; 21(24): 7514-7521
Published online Jun 28, 2015. doi: 10.3748/wjg.v21.i24.7514
Published online Jun 28, 2015. doi: 10.3748/wjg.v21.i24.7514
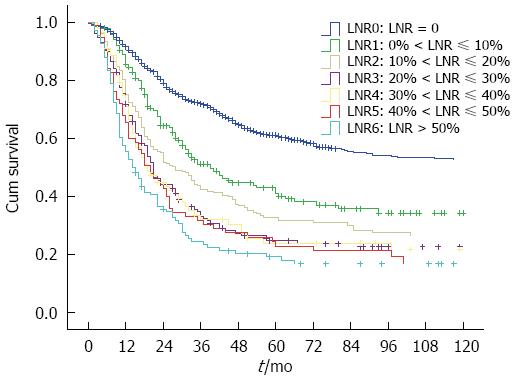
Figure 1 Kaplan-Meier curves for overall survival according to different intervals of LNR.
The P value for LNR0 vs LNR1: < 0.001, LNR1 vs LNR2: 0.021, LNR2 vs LNR3: 0.031. No significant survival differences were observed between LNR3 to LNR6 (P > 0.05).
- Citation: Chen SB, Weng HR, Wang G, Zou XF, Liu DT, Chen YP, Zhang H. Lymph node ratio-based staging system for esophageal squamous cell carcinoma. World J Gastroenterol 2015; 21(24): 7514-7521
- URL: https://www.wjgnet.com/1007-9327/full/v21/i24/7514.htm
- DOI: https://dx.doi.org/10.3748/wjg.v21.i24.7514


