Copyright
©The Author(s) 2015.
World J Gastroenterol. Jun 7, 2015; 21(21): 6591-6603
Published online Jun 7, 2015. doi: 10.3748/wjg.v21.i21.6591
Published online Jun 7, 2015. doi: 10.3748/wjg.v21.i21.6591
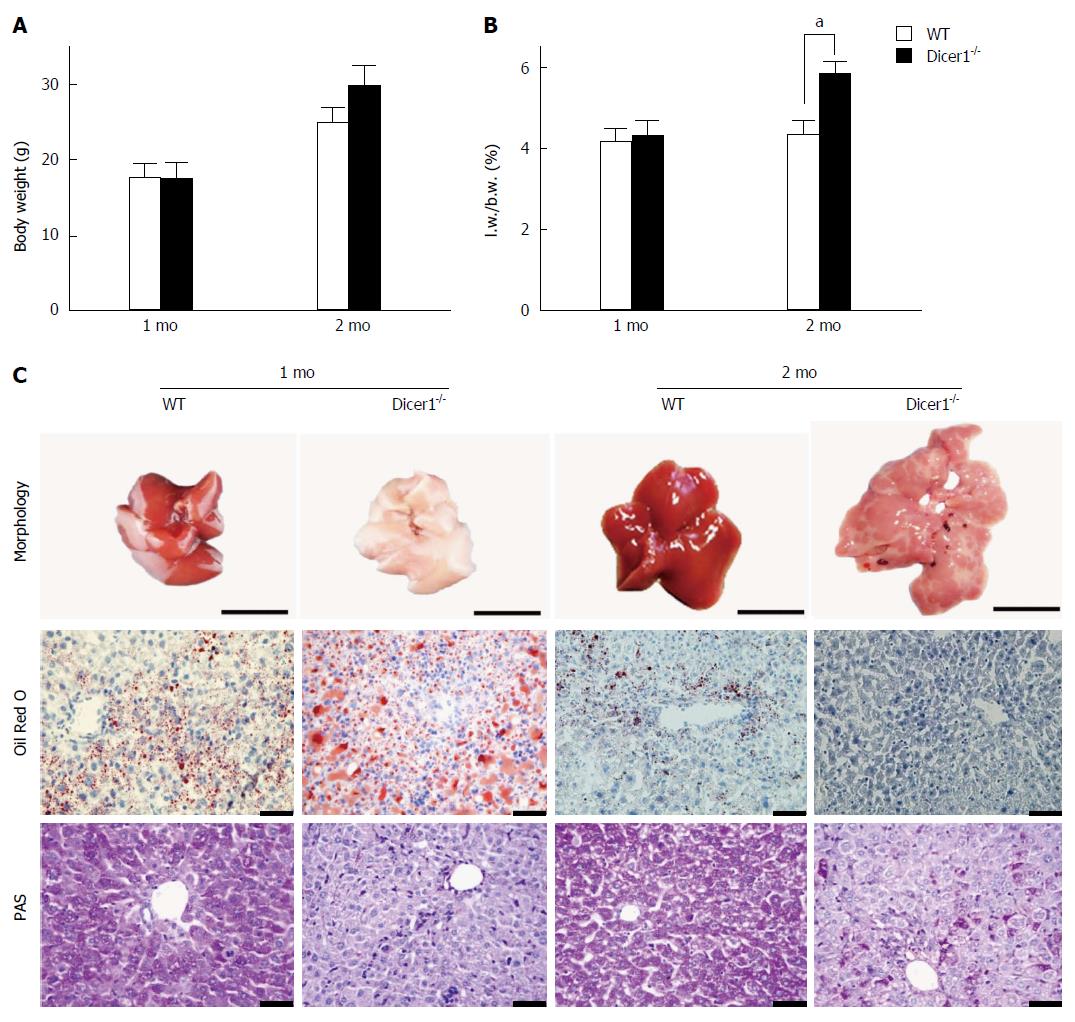
Figure 2 Morphology and metabolism changes of Dicer1-/- liver at indicated age.
A, B: Body weight and the ratio of liver weight/body weight (l.w./b.w.) in wild-type and Dicer1-/- mice (mean ± SD; n = 6), aP < 0.05 vs wild-type mice, l.w. vs b.w.; C: Gross observation of the livers (Scale bar: 1 cm). PAS staining and Oil Red O staining were performed respectively to detect the abnormal changes of Dicer1-deficient livers (Scale bar: 100 μm).
- Citation: Lu XF, Zhou YJ, Zhang L, Ji HJ, Li L, Shi YJ, Bu H. Loss of Dicer1 impairs hepatocyte survival and leads to chronic inflammation and progenitor cell activation. World J Gastroenterol 2015; 21(21): 6591-6603
- URL: https://www.wjgnet.com/1007-9327/full/v21/i21/6591.htm
- DOI: https://dx.doi.org/10.3748/wjg.v21.i21.6591


