Copyright
©The Author(s) 2015.
World J Gastroenterol. Jun 7, 2015; 21(21): 6582-6590
Published online Jun 7, 2015. doi: 10.3748/wjg.v21.i21.6582
Published online Jun 7, 2015. doi: 10.3748/wjg.v21.i21.6582
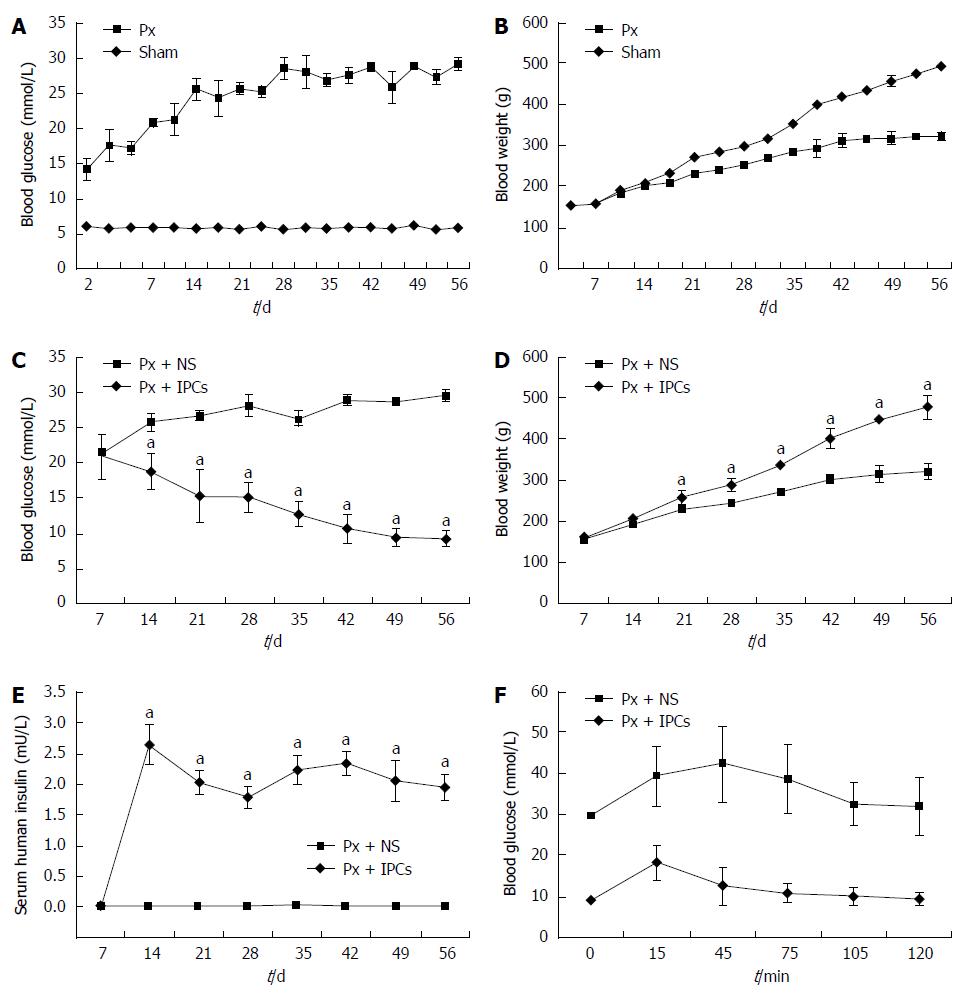
Figure 4 Blood glucose and body weight of rats after surgery.
Fed blood glucose levels and body weight in Px and sham rats following surgery A: Blood glucose level was higher in Px vs sham on day 2 following surgery and throughout the protocol (P < 0.05); B: Body weight was lower in Px vs sham on day 17 following surgery and throughout the rest of the protocol (P < 0.05). Px ( = 10); sham (n = 8); C: Blood glucose level changes of sham-treated controls (n = 8) and rats that received cell transplantation (n = 6); D: Body weight changes; E: Serum insulin levels. Results are mean ± SE. aP < 0.05 vs controls; F: Improvements in glucose tolerance in diabetic Sprague-Dawley rats transplanted with mesenchymal stem cells. At the indicated time points, blood glucose levels were measured in samples from the angular vein using a glucometer. Results are mean ± SD (n = 6).
- Citation: Yu YB, Bian JM, Gu DH. Transplantation of insulin-producing cells to treat diabetic rats after 90% pancreatectomy. World J Gastroenterol 2015; 21(21): 6582-6590
- URL: https://www.wjgnet.com/1007-9327/full/v21/i21/6582.htm
- DOI: https://dx.doi.org/10.3748/wjg.v21.i21.6582


