Copyright
©The Author(s) 2015.
World J Gastroenterol. Jun 7, 2015; 21(21): 6526-6542
Published online Jun 7, 2015. doi: 10.3748/wjg.v21.i21.6526
Published online Jun 7, 2015. doi: 10.3748/wjg.v21.i21.6526
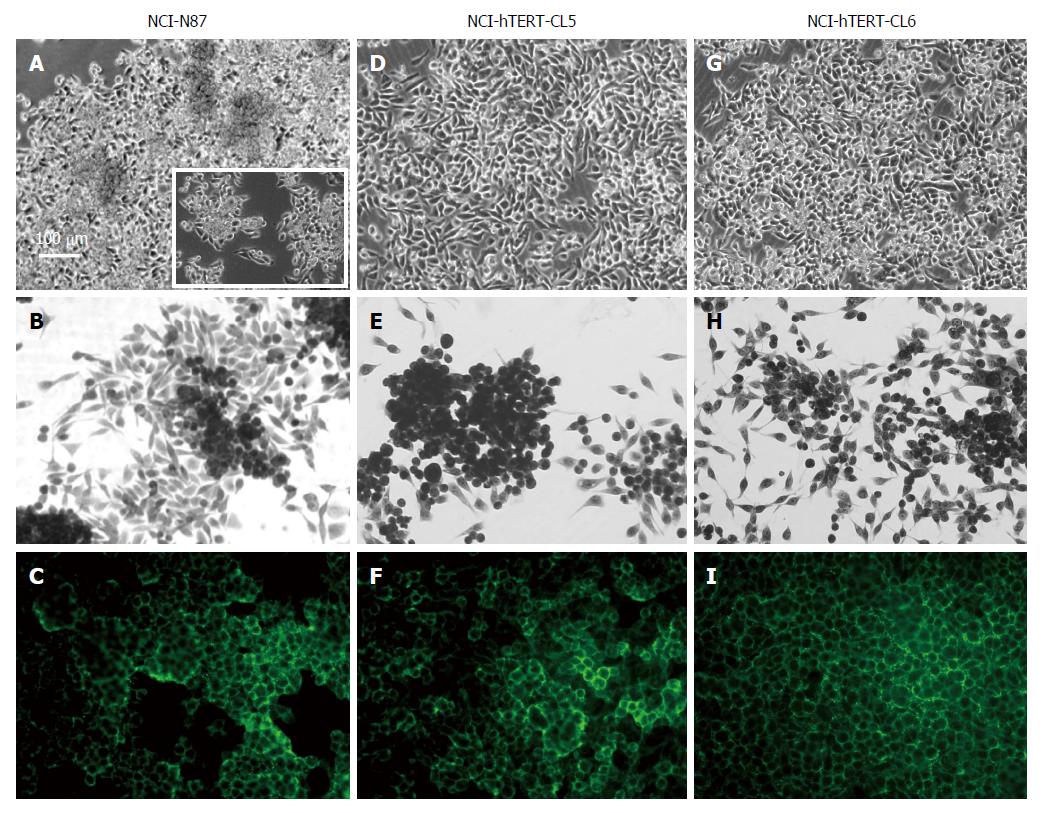
Figure 2 Microscopy analysis of NCI-N87 and NCI-hTERT-clones CL5 and CL6 cell lines.
Confluent cultures (A, D, G); square in (A and B), subconfluent cultures (E and H); E-cadherin immunodetection (C, F and I) (green; 1:1000, E-cadherin mAb plus FITC-conjugated secondary Ab). White bar: 100 μm.
- Citation: Saraiva-Pava K, Navabi N, Skoog EC, Lindén SK, Oleastro M, Roxo-Rosa M. New NCI-N87-derived human gastric epithelial line after human telomerase catalytic subunit over-expression. World J Gastroenterol 2015; 21(21): 6526-6542
- URL: https://www.wjgnet.com/1007-9327/full/v21/i21/6526.htm
- DOI: https://dx.doi.org/10.3748/wjg.v21.i21.6526


