Copyright
©The Author(s) 2015.
World J Gastroenterol. May 28, 2015; 21(20): 6180-6193
Published online May 28, 2015. doi: 10.3748/wjg.v21.i20.6180
Published online May 28, 2015. doi: 10.3748/wjg.v21.i20.6180
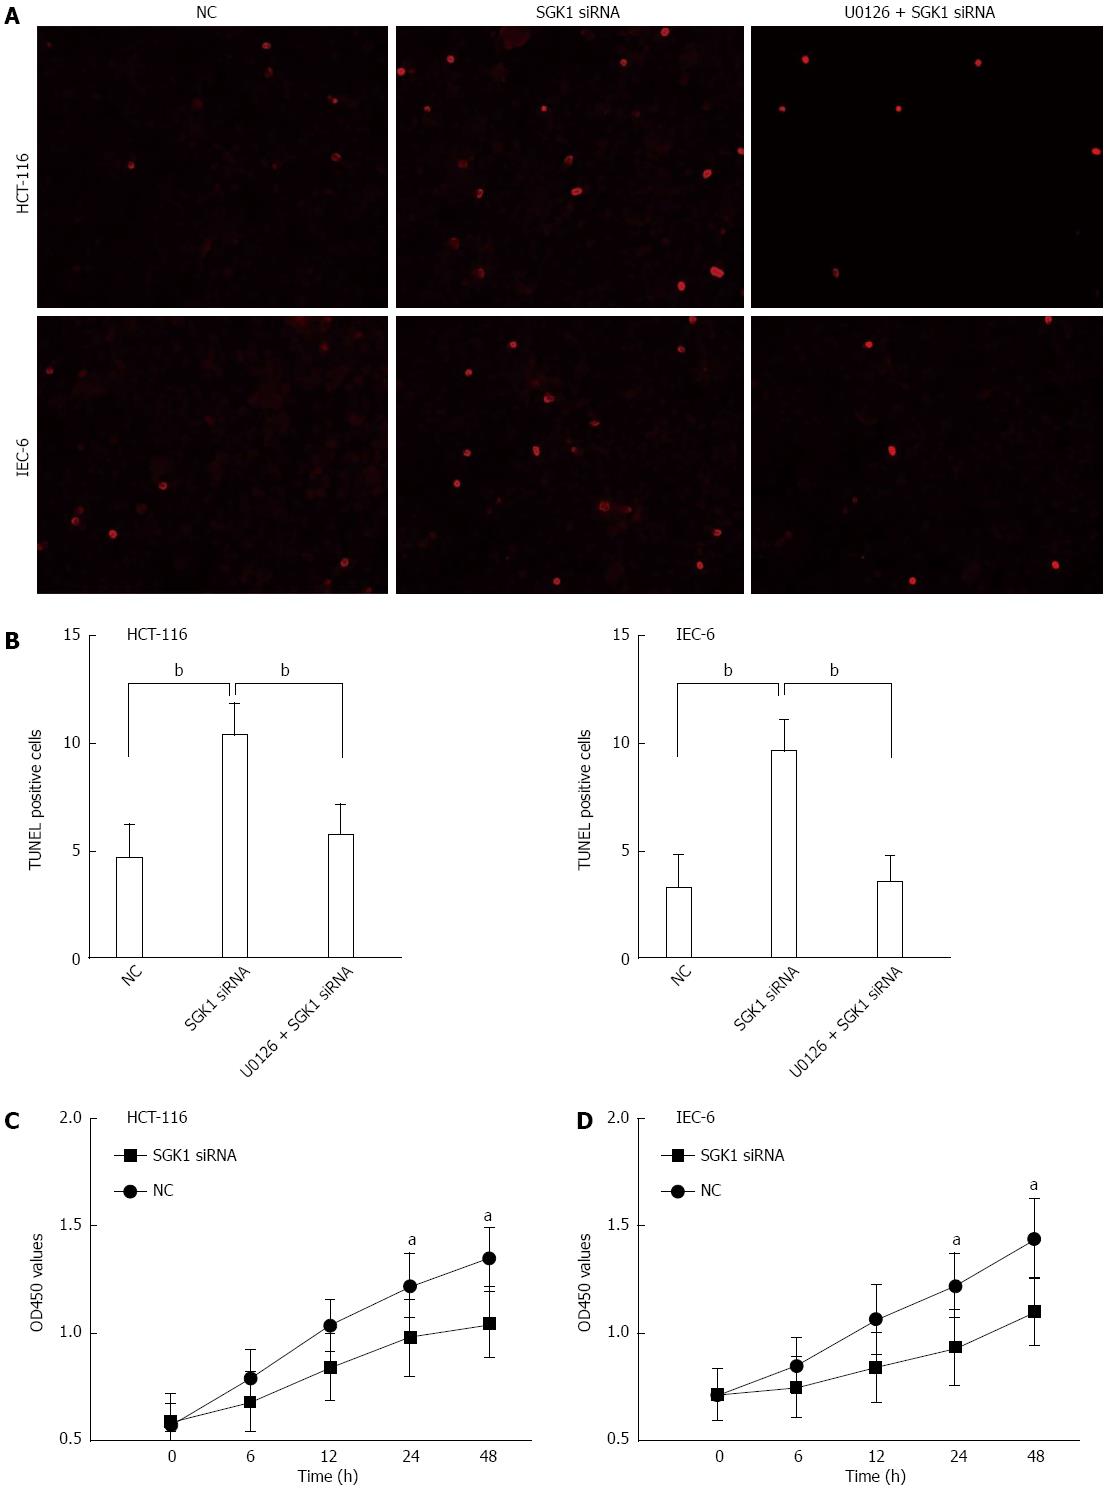
Figure 5 Intestinal epithelial cell apoptosis and proliferation analyzed by TUNEL and CCK-8 assays.
A: After the indicated treatment for 48 h, the cells were TdT-UTP nick end labeled and photographed with a fluorescent microscope. Scale bar = 200 μm. The TUNEL-positive cells are colored green; B: Quantitation of TUNEL-positive intestinal epithelial cells (IECs) was performed on all groups. All values are mean ± SD from 6 independent images in each group; C: For the CCK-8 assay, IECs were transfected with SGK1 siRNA or negative control siRNA (NC) as described above. OD450 values indicate the absorbance of IECs post-transfected at a wavelength of 450 nm. The OD450 values of IEC-6 and HCT-116 cells are shown in C and D, respectively. aP < 0.05 and bP < 0.01 vs negative controls.
-
Citation: Bai JA, Xu GF, Yan LJ, Zeng WW, Ji QQ, Wu JD, Tang QY. SGK1 inhibits cellular apoptosis and promotes proliferation
via the MEK/ERK/p53 pathway in colitis. World J Gastroenterol 2015; 21(20): 6180-6193 - URL: https://www.wjgnet.com/1007-9327/full/v21/i20/6180.htm
- DOI: https://dx.doi.org/10.3748/wjg.v21.i20.6180


