Copyright
©The Author(s) 2015.
World J Gastroenterol. May 21, 2015; 21(19): 5985-5994
Published online May 21, 2015. doi: 10.3748/wjg.v21.i19.5985
Published online May 21, 2015. doi: 10.3748/wjg.v21.i19.5985
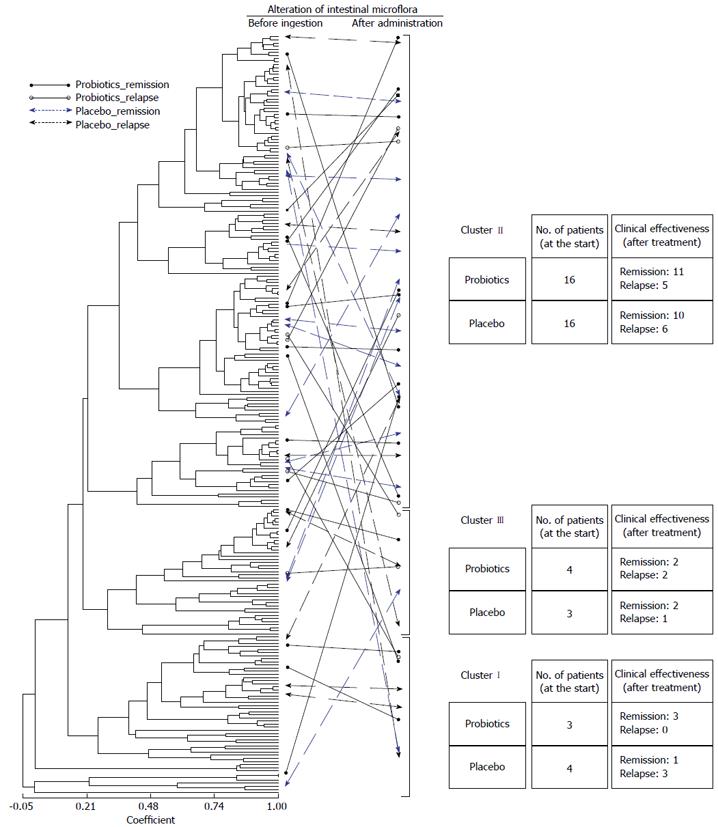
Figure 3 Alteration of intestinal microflora after treatment in the Bio-Three group and placebo group.
The dendrogram indicates the similarity of individual intestinal microflora T-RFLP patterns of fecal samples obtained after 0, 3, 6, 9, and 12 mo of treatment. Solid line and circles, Bio-Three group and remission; double line and open circles, Bio-Three group and relapse; solid dotted line and arrows, placebo group and remission; double dotted line and arrows, placebo group and relapse. The first and last samples from the same individuals are connected with lines. The tables indicate clinical effectiveness according to the cluster that the subjects belonged to at the start of this study.
- Citation: Yoshimatsu Y, Yamada A, Furukawa R, Sono K, Osamura A, Nakamura K, Aoki H, Tsuda Y, Hosoe N, Takada N, Suzuki Y. Effectiveness of probiotic therapy for the prevention of relapse in patients with inactive ulcerative colitis. World J Gastroenterol 2015; 21(19): 5985-5994
- URL: https://www.wjgnet.com/1007-9327/full/v21/i19/5985.htm
- DOI: https://dx.doi.org/10.3748/wjg.v21.i19.5985


