Copyright
©The Author(s) 2015.
World J Gastroenterol. May 21, 2015; 21(19): 5961-5971
Published online May 21, 2015. doi: 10.3748/wjg.v21.i19.5961
Published online May 21, 2015. doi: 10.3748/wjg.v21.i19.5961
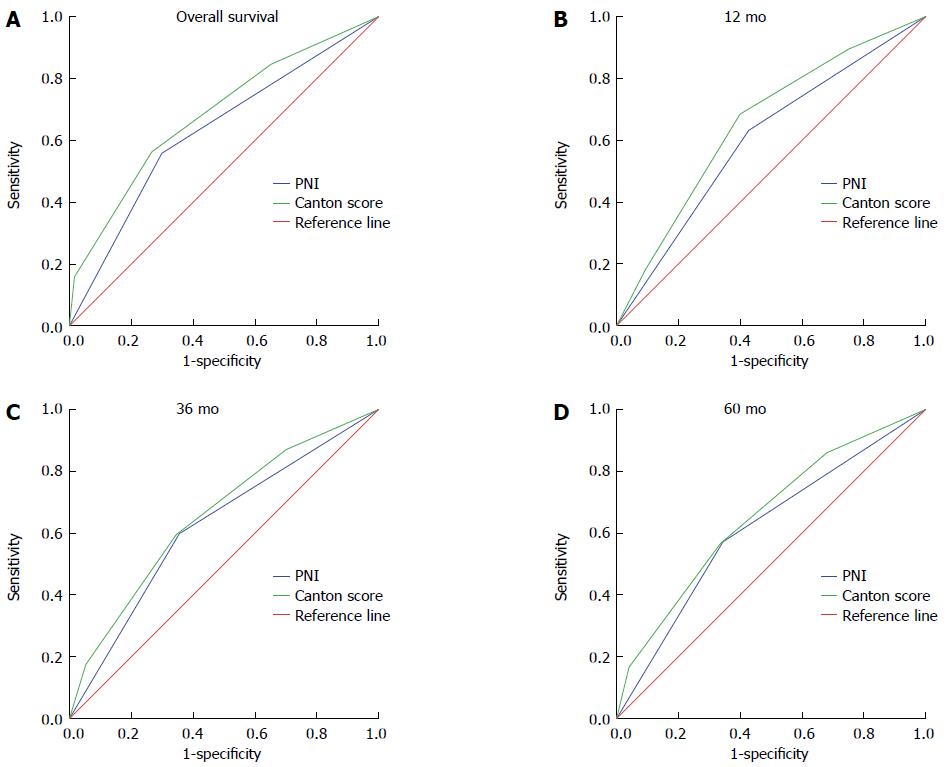
Figure 3 Comparison of the areas under the receiver operating characteristic curve for survival of gastric cancer patients based on prognostic nutritional index and Canton score at the end of follow-up (A), or after 12 mo (B), 36 mo (C), or 60 mo (D).
The areas under the receiver operating characteristic curve at these four points were significantly greater for Canton score than for prognostic nutritional index (PNI) (P = 0.024, P = 0.022, P = 0.030 and P < 0.001, respectively).
- Citation: Sun KY, Xu JB, Chen SL, Yuan YJ, Wu H, Peng JJ, Chen CQ, Guo P, Hao YT, He YL. Novel immunological and nutritional-based prognostic index for gastric cancer. World J Gastroenterol 2015; 21(19): 5961-5971
- URL: https://www.wjgnet.com/1007-9327/full/v21/i19/5961.htm
- DOI: https://dx.doi.org/10.3748/wjg.v21.i19.5961


