Copyright
©The Author(s) 2015.
World J Gastroenterol. May 21, 2015; 21(19): 5884-5892
Published online May 21, 2015. doi: 10.3748/wjg.v21.i19.5884
Published online May 21, 2015. doi: 10.3748/wjg.v21.i19.5884
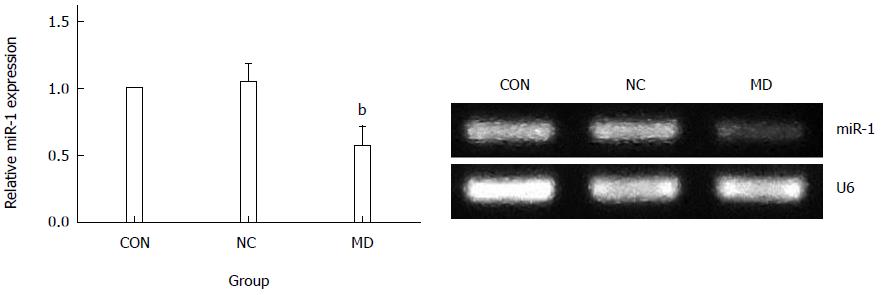
Figure 3 MiR-1 expression in cells of the three groups.
The expression of miR-1 was significantly decreased in the MD group compared with the NC and CON groups (P < 0.01). There was no significant difference between the NC group and CON group (P > 0.05). bP < 0.01 vs CON and NC group. MD: Micro-down; NC: Negative control; CON: Control.
- Citation: Hu C, Shen SQ, Cui ZH, Chen ZB, Li W. Effect of microRNA-1 on hepatocellular carcinoma tumor endothelial cells. World J Gastroenterol 2015; 21(19): 5884-5892
- URL: https://www.wjgnet.com/1007-9327/full/v21/i19/5884.htm
- DOI: https://dx.doi.org/10.3748/wjg.v21.i19.5884


