Copyright
©The Author(s) 2015.
World J Gastroenterol. May 14, 2015; 21(18): 5607-5621
Published online May 14, 2015. doi: 10.3748/wjg.v21.i18.5607
Published online May 14, 2015. doi: 10.3748/wjg.v21.i18.5607
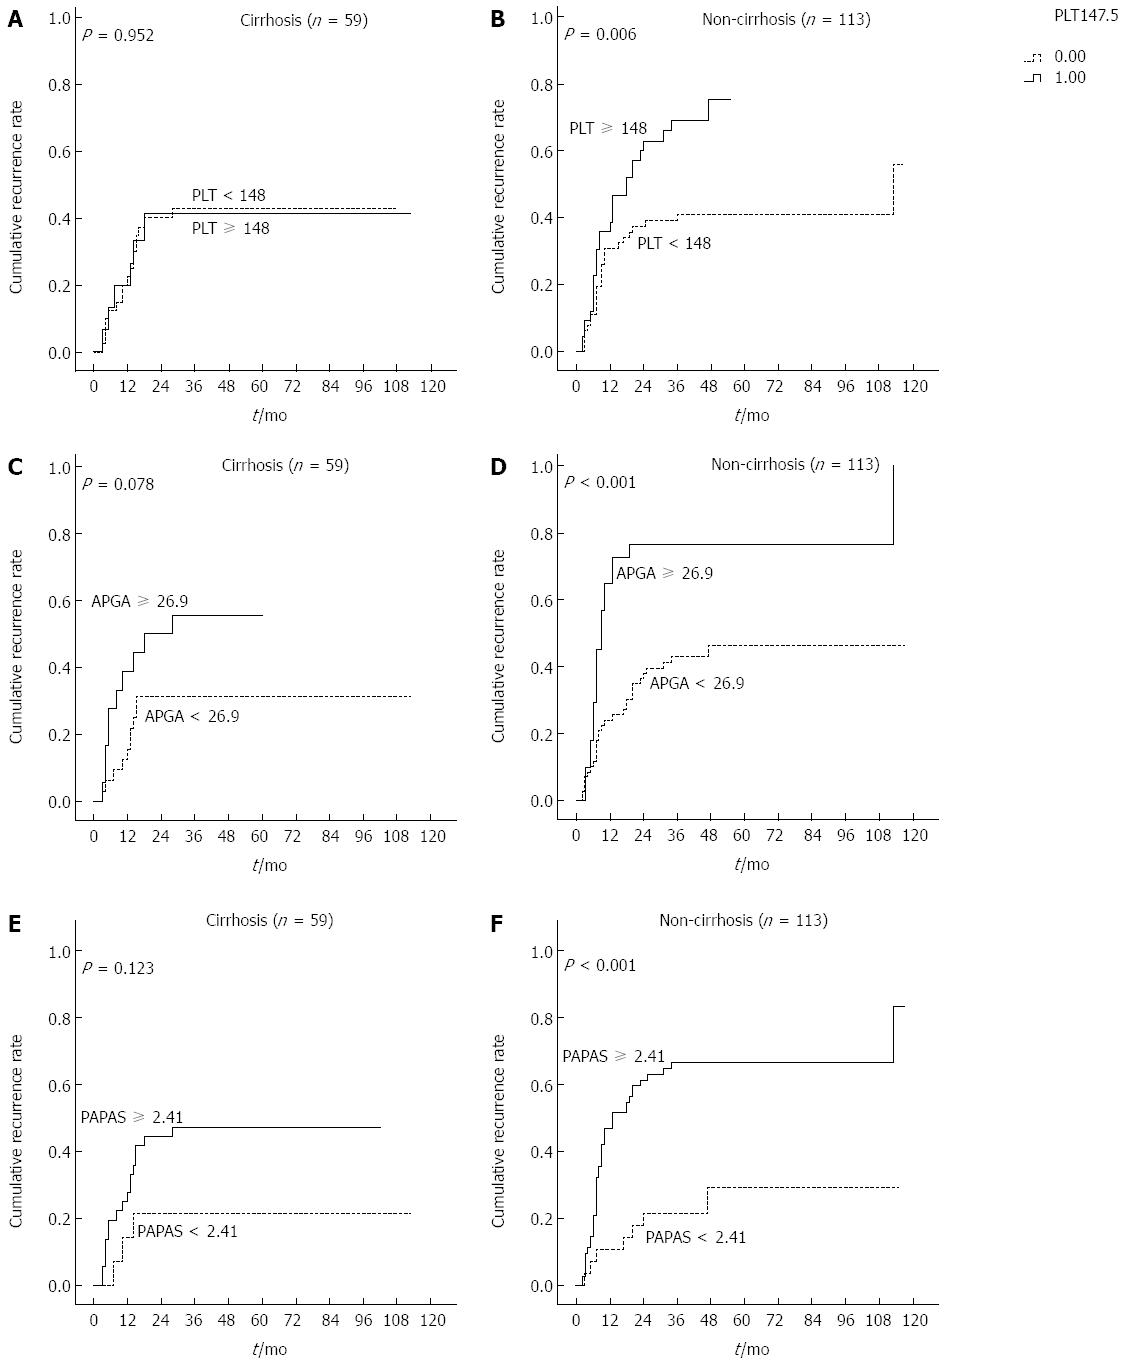
Figure 7 Cumulative recurrence curves of cirrhotic and non-cirrhotic patients.
Kaplan-Meier curves of patients stratified according to A, B: Platelet count (PLT); C, D: Aspartate aminotransferase/PLT/γ-glutamyl transpeptidase/alpha-fetoprotein (APGA) index; E, F: PLT/age/alkaline phosphatase/alpha-fetoprotein/aspartate aminotransferase (PAPAS) index.
- Citation: Pang Q, Zhang JY, Xu XS, Song SD, Qu K, Chen W, Zhou YY, Miao RC, Liu SS, Dong YF, Liu C. Significance of platelet count and platelet-based models for hepatocellular carcinoma recurrence. World J Gastroenterol 2015; 21(18): 5607-5621
- URL: https://www.wjgnet.com/1007-9327/full/v21/i18/5607.htm
- DOI: https://dx.doi.org/10.3748/wjg.v21.i18.5607


