Copyright
©The Author(s) 2015.
World J Gastroenterol. Apr 28, 2015; 21(16): 5017-5022
Published online Apr 28, 2015. doi: 10.3748/wjg.v21.i16.5017
Published online Apr 28, 2015. doi: 10.3748/wjg.v21.i16.5017
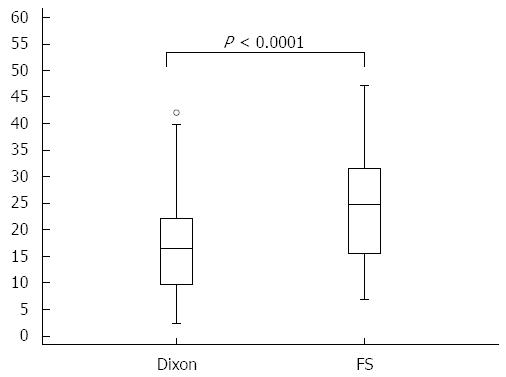
Figure 3 Box-and-whisker plots show median and interquartile ranges for liver-to-lesion contrast in hapatobiliary phase for chemically selective fat saturation-volumetric interpolated breath-hold examination and 2-point Dixon fat-water separation-volumetric interpolated breath-hold examination.
- Citation: Ding Y, Rao SX, Chen CZ, Li RC, Zeng MS. Usefulness of two-point Dixon fat-water separation technique in gadoxetic acid-enhanced liver magnetic resonance imaging. World J Gastroenterol 2015; 21(16): 5017-5022
- URL: https://www.wjgnet.com/1007-9327/full/v21/i16/5017.htm
- DOI: https://dx.doi.org/10.3748/wjg.v21.i16.5017


